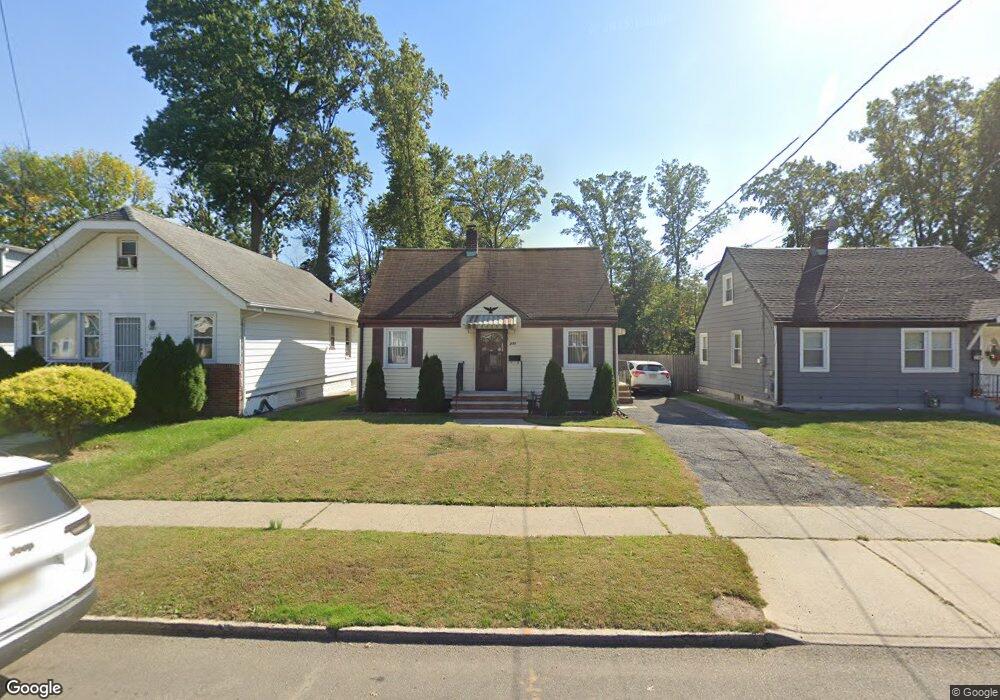
238 E 7th Ave Roselle, NJ 07203
Estimated Value: $437,894 - $501,000
Studio
--
Bath
1,344
Sq Ft
$348/Sq Ft
Est. Value
About This Home
This home is located at 238 E 7th Ave, Roselle, NJ 07203 and is currently estimated at $468,298, approximately $348 per square foot. 238 E 7th Ave is a home located in Union County with nearby schools including Dr Charles C Polk School, Leonard V. Moore Middle School, and Grace Wilday Junior High School.
Ownership History
Date
Name
Owned For
Owner Type
Purchase Details
Closed on
Apr 7, 2008
Sold by
Taylor Felicia
Bought by
Mirville Wailey and Vilceus Marie Mireille
Current Estimated Value
Home Financials for this Owner
Home Financials are based on the most recent Mortgage that was taken out on this home.
Original Mortgage
$247,000
Outstanding Balance
$159,136
Interest Rate
6.3%
Mortgage Type
Purchase Money Mortgage
Estimated Equity
$309,162
Purchase Details
Closed on
May 17, 1999
Sold by
Bowden Ida
Bought by
Taylor Felicia
Home Financials for this Owner
Home Financials are based on the most recent Mortgage that was taken out on this home.
Original Mortgage
$79,000
Interest Rate
6.88%
Create a Home Valuation Report for This Property
The Home Valuation Report is an in-depth analysis detailing your home's value as well as a comparison with similar homes in the area
Home Values in the Area
Average Home Value in this Area
Purchase History
| Date | Buyer | Sale Price | Title Company |
|---|---|---|---|
| Mirville Wailey | $260,000 | Chicago Title Insurance Co | |
| Taylor Felicia | $91,000 | -- |
Source: Public Records
Mortgage History
| Date | Status | Borrower | Loan Amount |
|---|---|---|---|
| Open | Mirville Wailey | $247,000 | |
| Previous Owner | Taylor Felicia | $79,000 |
Source: Public Records
Tax History
| Year | Tax Paid | Tax Assessment Tax Assessment Total Assessment is a certain percentage of the fair market value that is determined by local assessors to be the total taxable value of land and additions on the property. | Land | Improvement |
|---|---|---|---|---|
| 2025 | $8,469 | $97,400 | $56,300 | $41,100 |
| 2024 | $8,257 | $97,400 | $56,300 | $41,100 |
| 2023 | $8,257 | $97,400 | $56,300 | $41,100 |
| 2022 | $8,314 | $97,400 | $56,300 | $41,100 |
| 2021 | $8,264 | $97,400 | $56,300 | $41,100 |
| 2020 | $8,238 | $97,400 | $56,300 | $41,100 |
| 2019 | $8,133 | $97,400 | $56,300 | $41,100 |
| 2018 | $8,088 | $97,400 | $56,300 | $41,100 |
| 2017 | $8,045 | $97,400 | $56,300 | $41,100 |
| 2016 | $7,868 | $97,400 | $56,300 | $41,100 |
| 2015 | $7,867 | $97,400 | $56,300 | $41,100 |
| 2014 | $7,648 | $97,400 | $56,300 | $41,100 |
Source: Public Records
Map
Nearby Homes
- 247 E 7th Ave
- 226 E 8th Ave
- 238 E 8th Ave
- 208 E 8th Ave
- 902 Spruce St
- 211 E 10th Ave
- 123 E 6th Ave
- 310 Stockton Ave
- 114 E 5th Ave
- 146 E 10th Ave Unit 2
- 1022 Frank St
- 424 E 4th Ave
- 126 W 5th Ave
- 410 Morris Place
- 1025 Rivington St
- 415 E 10th Ave
- 210 W 7th Ave
- 502 Drake Ave
- 415 E 3rd Ave Unit 3
- 761 Drake Ave
Your Personal Tour Guide
Ask me questions while you tour the home.