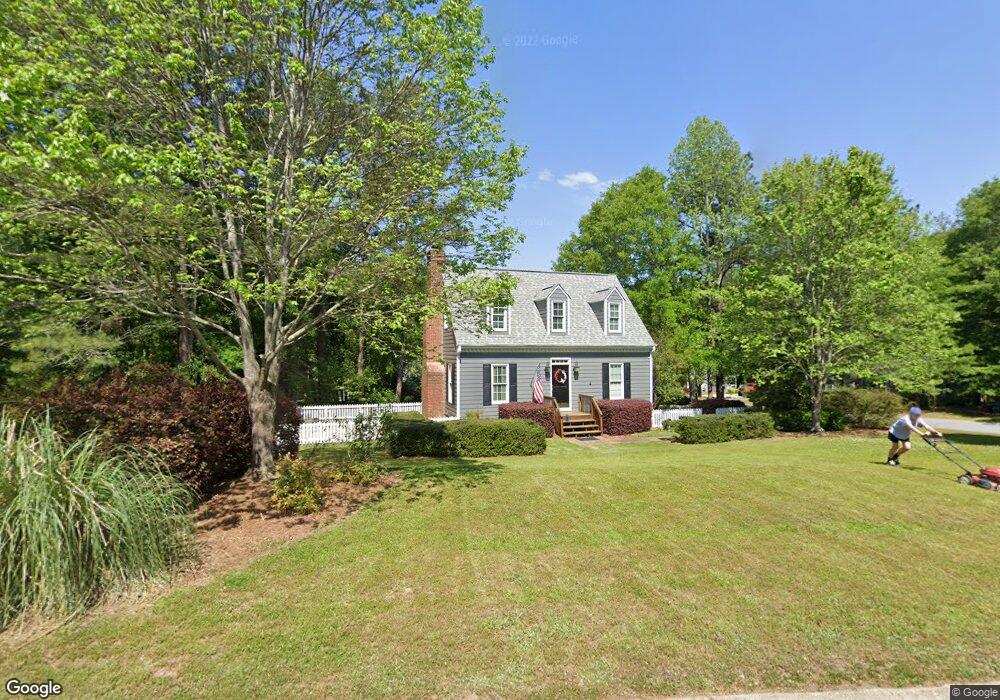
238 Farlow Dr Unit 2 Winder, GA 30680
Estimated Value: $310,006 - $333,000
3
Beds
3
Baths
1,342
Sq Ft
$238/Sq Ft
Est. Value
About This Home
This home is located at 238 Farlow Dr Unit 2, Winder, GA 30680 and is currently estimated at $319,502, approximately $238 per square foot. 238 Farlow Dr Unit 2 is a home located in Barrow County with nearby schools including Holsenbeck Elementary School, Bear Creek Middle School, and Winder-Barrow High School.
Ownership History
Date
Name
Owned For
Owner Type
Purchase Details
Closed on
Jan 16, 2008
Sold by
Fields Jason R and Fields Jessica D
Bought by
Fields Jason R and Fields Jessica D
Current Estimated Value
Purchase Details
Closed on
Nov 30, 2006
Sold by
Roberson J Christian and Roberson Leann H
Bought by
Fields Jason R and Dinsmore Jessica
Home Financials for this Owner
Home Financials are based on the most recent Mortgage that was taken out on this home.
Original Mortgage
$142,900
Interest Rate
6.36%
Mortgage Type
New Conventional
Purchase Details
Closed on
Feb 27, 2001
Sold by
Daino Kimberly A
Bought by
Roberson J Christian
Home Financials for this Owner
Home Financials are based on the most recent Mortgage that was taken out on this home.
Original Mortgage
$123,954
Interest Rate
7.02%
Mortgage Type
FHA
Purchase Details
Closed on
Aug 12, 1996
Sold by
Mcnichols Harold and Adams Deborah
Bought by
Daino Kimberly
Create a Home Valuation Report for This Property
The Home Valuation Report is an in-depth analysis detailing your home's value as well as a comparison with similar homes in the area
Home Values in the Area
Average Home Value in this Area
Purchase History
| Date | Buyer | Sale Price | Title Company |
|---|---|---|---|
| Fields Jason R | -- | -- | |
| Fields Jason R | $142,900 | -- | |
| Roberson J Christian | $125,900 | -- | |
| Daino Kimberly | $90,000 | -- |
Source: Public Records
Mortgage History
| Date | Status | Borrower | Loan Amount |
|---|---|---|---|
| Previous Owner | Fields Jason R | $142,900 | |
| Previous Owner | Roberson J Christian | $123,954 | |
| Closed | Daino Kimberly | $0 |
Source: Public Records
Tax History Compared to Growth
Tax History
| Year | Tax Paid | Tax Assessment Tax Assessment Total Assessment is a certain percentage of the fair market value that is determined by local assessors to be the total taxable value of land and additions on the property. | Land | Improvement |
|---|---|---|---|---|
| 2024 | $2,362 | $86,346 | $25,400 | $60,946 |
| 2023 | $1,520 | $86,346 | $25,400 | $60,946 |
| 2022 | $2,241 | $68,288 | $20,000 | $48,288 |
| 2021 | $1,881 | $55,910 | $16,800 | $39,110 |
| 2020 | $1,762 | $53,510 | $14,400 | $39,110 |
| 2019 | $1,735 | $51,981 | $14,400 | $37,581 |
| 2018 | $1,484 | $44,592 | $11,600 | $32,992 |
| 2017 | $1,110 | $37,201 | $12,000 | $25,201 |
| 2016 | $1,127 | $37,217 | $12,800 | $24,417 |
| 2015 | $1,139 | $37,518 | $12,800 | $24,718 |
| 2014 | $927 | $31,880 | $6,860 | $25,020 |
| 2013 | -- | $31,138 | $6,860 | $24,278 |
Source: Public Records
Map
Nearby Homes
- 27 Creekside Dr
- 197 Buena Vista St
- 318 Ryan Rd
- 5 Olevia St
- 326 Miles Patrick Rd
- 401 N 5th Ave
- 303 Rocky Point Ct
- 615 Gainesville Hwy
- 172 Settle St
- 746 Baskins Cir
- 0 E Northcrest Dr Unit 10648147
- 82 Cedar Bluff
- 58 Cedar Bluff
- 412 Regan Dr
- 469 Plantation Dr
- 436 Northcrest Dr
- 381 W Candler St
- 980 Lake Rockwell Way
- 244 Farlow Dr
- 236 Ryan Rd
- 236 Ryan Rd Unit 2
- 241 Farlow Dr
- 237 Ryan Rd
- 243 Farlow Dr
- 246 Farlow Dr
- 235 Ryan Rd
- 245 Farlow Dr
- 245 Farlow Dr Unit 2
- 235 Lavern Ct
- 235 Laverne Ct
- 239 Ryan Rd Unit 2
- 247 Farlow Dr
- 233 Ryan Rd
- 248 Farlow Dr Unit A/35
- 248 Farlow Dr Unit 2
- 248 Farlow Dr
- 237 Laverne Ct
- 241 Ryan Rd Unit 12A