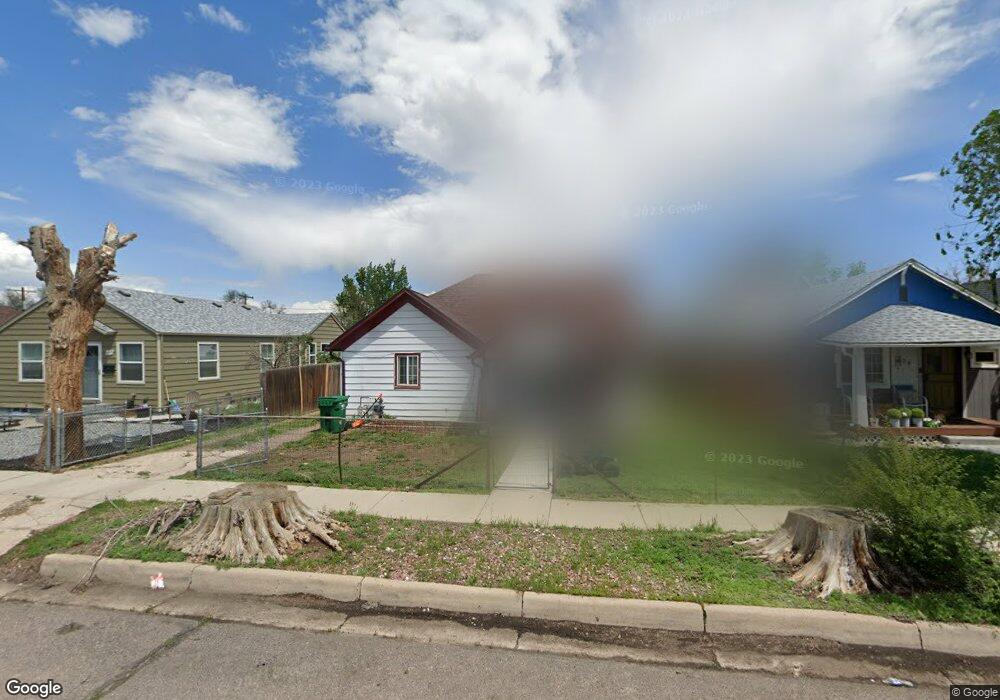
238 N 6th Ave Brighton, CO 80601
Estimated Value: $304,426 - $379,000
2
Beds
1
Bath
720
Sq Ft
$469/Sq Ft
Est. Value
About This Home
This home is located at 238 N 6th Ave, Brighton, CO 80601 and is currently estimated at $337,607, approximately $468 per square foot. 238 N 6th Ave is a home located in Adams County with nearby schools including Northeast Elementary School, Overland Trail Middle School, and Brighton High School.
Ownership History
Date
Name
Owned For
Owner Type
Purchase Details
Closed on
Nov 14, 2014
Sold by
Figueroa Jesus and Figueroa Silvia
Bought by
Figueroa Yesenia
Current Estimated Value
Purchase Details
Closed on
Jan 11, 1999
Sold by
Jesus Figueroa
Bought by
Figueroa Jesus and Figueroa Silvia
Home Financials for this Owner
Home Financials are based on the most recent Mortgage that was taken out on this home.
Original Mortgage
$43,000
Interest Rate
6.68%
Purchase Details
Closed on
Mar 10, 1992
Create a Home Valuation Report for This Property
The Home Valuation Report is an in-depth analysis detailing your home's value as well as a comparison with similar homes in the area
Home Values in the Area
Average Home Value in this Area
Purchase History
| Date | Buyer | Sale Price | Title Company |
|---|---|---|---|
| Figueroa Yesenia | -- | None Available | |
| Figueroa Jesus | -- | -- | |
| -- | $41,000 | -- |
Source: Public Records
Mortgage History
| Date | Status | Borrower | Loan Amount |
|---|---|---|---|
| Closed | Figueroa Jesus | $43,000 |
Source: Public Records
Tax History
| Year | Tax Paid | Tax Assessment Tax Assessment Total Assessment is a certain percentage of the fair market value that is determined by local assessors to be the total taxable value of land and additions on the property. | Land | Improvement |
|---|---|---|---|---|
| 2025 | $2,208 | $22,240 | $5,780 | $16,460 |
| 2024 | $2,208 | $20,440 | $5,310 | $15,130 |
| 2023 | $2,198 | $23,680 | $5,410 | $18,270 |
| 2022 | $2,152 | $19,590 | $4,930 | $14,660 |
| 2021 | $2,017 | $19,590 | $4,930 | $14,660 |
| 2020 | $1,661 | $16,820 | $4,860 | $11,960 |
| 2019 | $1,663 | $16,820 | $4,860 | $11,960 |
| 2018 | $1,255 | $12,690 | $4,750 | $7,940 |
| 2017 | $1,253 | $12,690 | $4,750 | $7,940 |
| 2016 | $711 | $7,170 | $2,390 | $4,780 |
| 2015 | $709 | $7,170 | $2,390 | $4,780 |
| 2014 | $797 | $8,180 | $1,910 | $6,270 |
Source: Public Records
Map
Nearby Homes