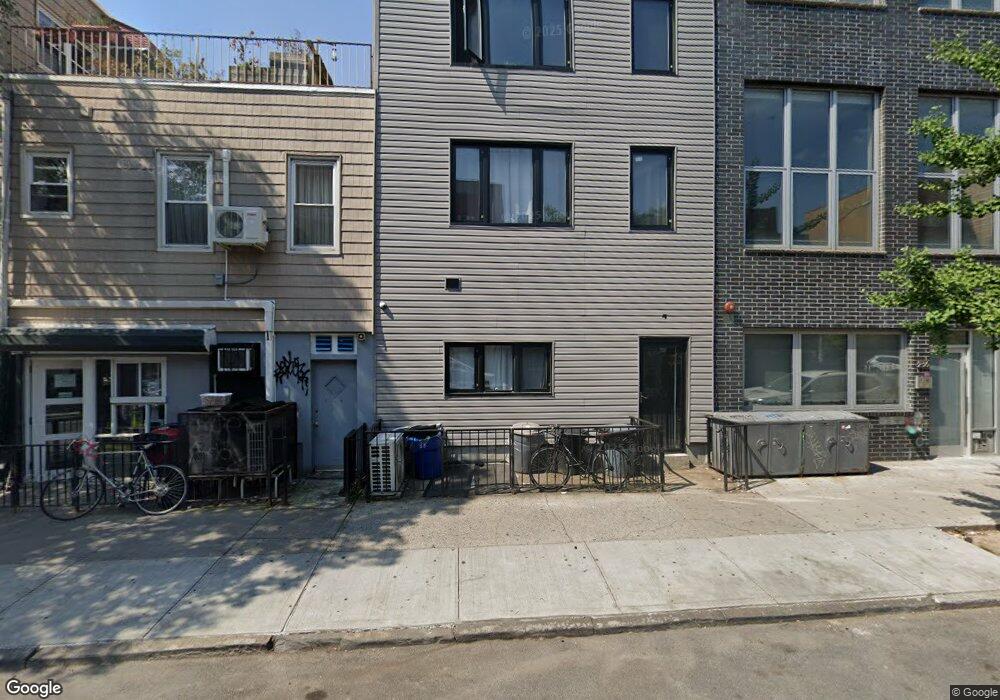
238 N 7th St Brooklyn, NY 11211
Williamsburg NeighborhoodEstimated Value: $2,548,000 - $3,180,000
--
Bed
--
Bath
2,404
Sq Ft
$1,180/Sq Ft
Est. Value
About This Home
This home is located at 238 N 7th St, Brooklyn, NY 11211 and is currently estimated at $2,837,333, approximately $1,180 per square foot. 238 N 7th St is a home located in Kings County with nearby schools including P.S. 17 Henry D Woodworth and Success Academy Williamsburg.
Ownership History
Date
Name
Owned For
Owner Type
Purchase Details
Closed on
May 24, 2016
Sold by
Carmine A Esposito Trustee and Daniel P
Bought by
Rubinov Konstantin
Current Estimated Value
Home Financials for this Owner
Home Financials are based on the most recent Mortgage that was taken out on this home.
Original Mortgage
$1,620,000
Outstanding Balance
$1,289,632
Interest Rate
3.66%
Mortgage Type
Purchase Money Mortgage
Estimated Equity
$1,547,701
Purchase Details
Closed on
Oct 17, 2001
Sold by
Esposito John
Bought by
Esposito Carmine A and Esposito 2001 Trust
Purchase Details
Closed on
Jan 17, 2000
Sold by
Cancilla Rose
Bought by
Esposito John and Esposito Antoinette
Purchase Details
Closed on
Sep 30, 1999
Sold by
Esposito Emanuel
Bought by
Cancilla Rose and Esposito John
Create a Home Valuation Report for This Property
The Home Valuation Report is an in-depth analysis detailing your home's value as well as a comparison with similar homes in the area
Home Values in the Area
Average Home Value in this Area
Purchase History
| Date | Buyer | Sale Price | Title Company |
|---|---|---|---|
| Rubinov Konstantin | $2,025,000 | -- | |
| Rubinov Konstantin | $2,025,000 | -- | |
| Esposito Carmine A | -- | Fidelity National Title Ins | |
| Esposito Carmine A | -- | Fidelity National Title Ins | |
| Esposito John | -- | -- | |
| Esposito John | -- | -- | |
| Cancilla Rose | -- | -- | |
| Cancilla Rose | -- | -- |
Source: Public Records
Mortgage History
| Date | Status | Borrower | Loan Amount |
|---|---|---|---|
| Open | Rubinov Konstantin | $1,620,000 | |
| Closed | Rubinov Konstantin | $1,620,000 |
Source: Public Records
Tax History Compared to Growth
Tax History
| Year | Tax Paid | Tax Assessment Tax Assessment Total Assessment is a certain percentage of the fair market value that is determined by local assessors to be the total taxable value of land and additions on the property. | Land | Improvement |
|---|---|---|---|---|
| 2025 | $3,886 | $183,360 | $22,500 | $160,860 |
| 2024 | $3,886 | $144,840 | $22,500 | $122,340 |
| 2023 | $3,710 | $132,720 | $22,500 | $110,220 |
| 2022 | $2,585 | $145,440 | $22,500 | $122,940 |
| 2021 | $3,431 | $159,480 | $22,500 | $136,980 |
| 2020 | $2,573 | $162,900 | $22,500 | $140,400 |
| 2019 | $3,373 | $129,540 | $22,500 | $107,040 |
| 2018 | $3,104 | $15,225 | $2,610 | $12,615 |
| 2017 | $2,933 | $14,389 | $2,983 | $11,406 |
| 2016 | $2,716 | $13,584 | $3,801 | $9,783 |
| 2015 | $380 | $13,584 | $4,503 | $9,081 |
| 2014 | $380 | $13,436 | $4,471 | $8,965 |
Source: Public Records
Map
Nearby Homes
- 224 N 6th St Unit 2
- 207 N 5th St Unit GARDEN
- 100 Roebling St
- 236 N 7th St Unit 4L
- 340 Metropolitan Ave
- 340 Metropolitan Ave Unit PHB
- 171 N 7th St Unit 3B
- 280 Metropolitan Ave Unit 2A
- 280 Metropolitan Ave Unit 5-D
- 510 Driggs Ave Unit 5-H
- 181 N 8th St
- 260 N 9th St Unit 7A
- 241 Grand St
- 308 N 7th St Unit 5A
- 171 N 1st St Unit 2B
- 171 N 1st St Unit 3-K
- 171 N 1st St Unit 3-C
- 215 N 10th St Unit 4-F
- 152 N 9th St Unit 1R
- 152 N 9th St Unit 1R
- 240 N 7th St
- 240 N 7th St Unit COMMERCIAL
- 236 E 7th St Unit 2-D
- 236 E 7th St Unit 2-R
- 236 E 7th St Unit 1-L
- 236 E 7th St Unit 1-R
- 236 E 7th St Unit 2-L
- 236 E 7th St Unit 3-D
- 236 E 7th St Unit 3-B
- 236 E 7th St Unit 1-D
- 236 E 7th St
- 236 E 7th St Unit 2-B
- 236 E 7th St Unit 3-C
- 236 N 7th St
- 236 N 7th St Unit 3
- 236 N 7th St
- 236 N 7th St Unit 3L
- 236 N 7th St Unit 4R
- 236 N 7th St Unit 2L
- 236 N 7th St Unit 3R