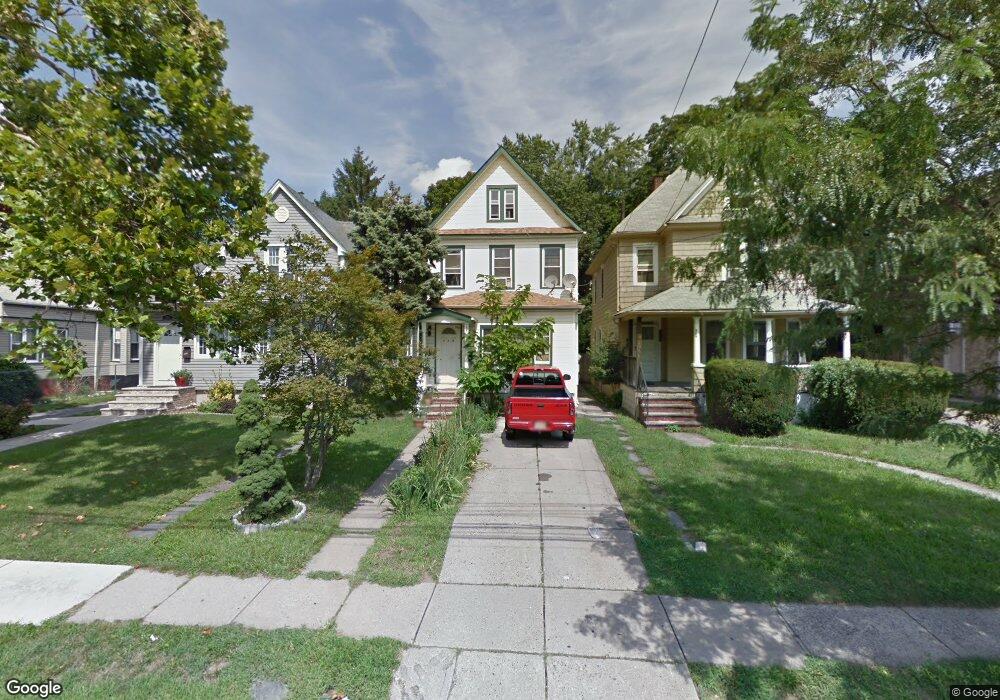
238 Passaic St Hackensack, NJ 07601
Estimated Value: $322,000 - $598,000
Studio
--
Bath
1,822
Sq Ft
$274/Sq Ft
Est. Value
About This Home
This home is located at 238 Passaic St, Hackensack, NJ 07601 and is currently estimated at $498,832, approximately $273 per square foot. 238 Passaic St is a home located in Bergen County with nearby schools including Hackensack High School and Bergen County Christian Academy.
Ownership History
Date
Name
Owned For
Owner Type
Purchase Details
Closed on
Apr 14, 2022
Sold by
Tenezaca Diana J
Bought by
Tenezaca Diana J
Current Estimated Value
Home Financials for this Owner
Home Financials are based on the most recent Mortgage that was taken out on this home.
Original Mortgage
$183,000
Interest Rate
5.11%
Mortgage Type
New Conventional
Purchase Details
Closed on
Jan 31, 2019
Sold by
Tenezaca Cristine A and Remache Carlos A
Bought by
Echeverria Miriam and Tenezaca Diana J
Home Financials for this Owner
Home Financials are based on the most recent Mortgage that was taken out on this home.
Original Mortgage
$176,739
Interest Rate
5.5%
Mortgage Type
FHA
Purchase Details
Closed on
Dec 7, 2015
Sold by
Peralta Jose and Peralta Griselda Peralta
Bought by
Tenezaca Cristian A Pinos and Remache Carlos A
Home Financials for this Owner
Home Financials are based on the most recent Mortgage that was taken out on this home.
Original Mortgage
$178,825
Interest Rate
3.87%
Mortgage Type
FHA
Purchase Details
Closed on
Oct 22, 2003
Sold by
Clark George
Bought by
Peralta Jose and Peralta Griselda
Home Financials for this Owner
Home Financials are based on the most recent Mortgage that was taken out on this home.
Original Mortgage
$236,292
Interest Rate
5.81%
Mortgage Type
FHA
Create a Home Valuation Report for This Property
The Home Valuation Report is an in-depth analysis detailing your home's value as well as a comparison with similar homes in the area
Home Values in the Area
Average Home Value in this Area
Purchase History
| Date | Buyer | Sale Price | Title Company |
|---|---|---|---|
| Tenezaca Diana J | $85,092 | Old Republic Title | |
| Tenezaca Diana J | $85,092 | Old Republic Title | |
| Echeverria Miriam | $180,000 | -- | |
| Tenezaca Cristian A Pinos | $185,000 | Foundation Title Llc | |
| Peralta Jose | $240,000 | -- |
Source: Public Records
Mortgage History
| Date | Status | Borrower | Loan Amount |
|---|---|---|---|
| Previous Owner | Tenezaca Diana J | $183,000 | |
| Previous Owner | Echeverria Miriam | $176,739 | |
| Previous Owner | Tenezaca Cristian A Pinos | $178,825 | |
| Previous Owner | Peralta Jose | $236,292 |
Source: Public Records
Tax History
| Year | Tax Paid | Tax Assessment Tax Assessment Total Assessment is a certain percentage of the fair market value that is determined by local assessors to be the total taxable value of land and additions on the property. | Land | Improvement |
|---|---|---|---|---|
| 2025 | $9,284 | $303,800 | $143,900 | $159,900 |
| 2024 | $8,746 | $303,800 | $143,900 | $159,900 |
| 2023 | $8,333 | $303,800 | $143,900 | $159,900 |
| 2022 | $8,333 | $297,400 | $138,500 | $158,900 |
| 2021 | $8,224 | $244,900 | $118,700 | $126,200 |
| 2020 | $8,104 | $244,900 | $118,700 | $126,200 |
| 2019 | $8,094 | $241,100 | $116,900 | $124,200 |
| 2018 | $8,102 | $237,400 | $114,200 | $123,200 |
| 2017 | $7,977 | $233,600 | $112,400 | $121,200 |
| 2016 | $7,519 | $222,600 | $103,400 | $119,200 |
| 2015 | $7,329 | $209,400 | $118,300 | $91,100 |
| 2014 | $6,956 | $209,400 | $118,300 | $91,100 |
Source: Public Records
Map
Nearby Homes
- 30 Clarendon Place
- 395 2nd St
- 208 Anderson St Unit S4F
- 208 Anderson St Unit 7SG
- 5 Linden St Unit 3C
- 252 Berry St
- 297 Hamilton Place
- 290 Anderson St Unit 5D
- 290 Anderson St Unit 2A
- 303 Hamilton Place Unit A4
- 303 Hamilton Place Unit D4
- 303 Hamilton Place Unit BAS1
- 285 Berry St
- 300 Lookout Ave Unit C4
- 344 Prospect Ave Unit 4C
- 326 Prospect Ave Unit 8E
- 326 Prospect Ave Unit 6J
- 326 Prospect Ave Unit 12A
- 326 Prospect Ave Unit 10H
- 433 Park St
- 236 Passaic St
- 240 Passaic St
- 244 Passaic St
- 239 Hamilton Place
- 246 Passaic St
- 241 Hamilton Place
- 231 Hamilton Place
- 233 Hamilton Place
- 243 Hamilton Place
- 243 Hamilton Place Unit 1
- 243 Hamilton Place Unit 2
- 226 Passaic St
- 227 Hamilton Place
- 239 Passaic St
- 252 Passaic St
- 247 Hamilton Place
- 231 Passaic St
- 243 Passaic St
- 247 Passaic St
- 229 Passaic St
Your Personal Tour Guide
Ask me questions while you tour the home.