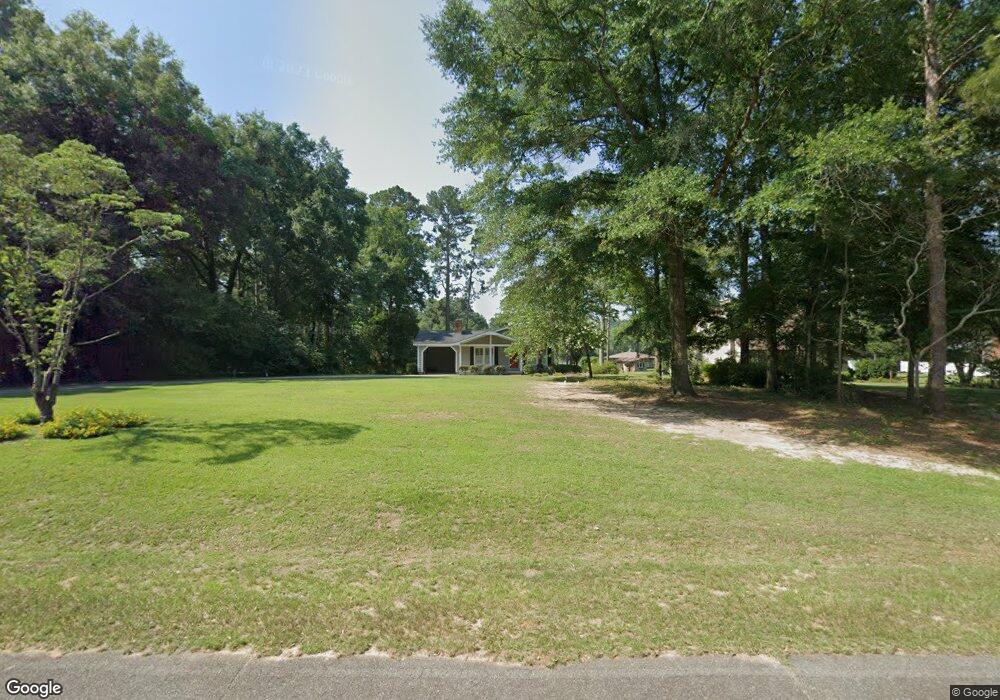
238 Valhalla Rd Cordele, GA 31015
Estimated Value: $456,616 - $629,000
2
Beds
2
Baths
1,422
Sq Ft
$383/Sq Ft
Est. Value
About This Home
This home is located at 238 Valhalla Rd, Cordele, GA 31015 and is currently estimated at $545,154, approximately $383 per square foot. 238 Valhalla Rd is a home located in Crisp County with nearby schools including Crisp County Elementary School, Crisp County Primary School, and Crisp County Middle School.
Ownership History
Date
Name
Owned For
Owner Type
Purchase Details
Closed on
Jun 9, 2017
Sold by
Belcher Paul E
Bought by
Register Jeffrey T and Register Janice S
Current Estimated Value
Home Financials for this Owner
Home Financials are based on the most recent Mortgage that was taken out on this home.
Original Mortgage
$197,000
Outstanding Balance
$163,211
Interest Rate
4.05%
Mortgage Type
New Conventional
Estimated Equity
$381,943
Purchase Details
Closed on
Dec 17, 2004
Sold by
Hughes Warren Ray
Bought by
Belcher Paul E and Belcher Marsha M
Purchase Details
Closed on
Jun 7, 2002
Sold by
Shiels Richard W and Shiels Lizabeth I
Bought by
Hughes Warren Ray
Purchase Details
Closed on
Jun 5, 2002
Bought by
Correct Error On Plat
Purchase Details
Closed on
Jun 4, 1999
Sold by
Holmes Harry
Bought by
Shiels Richard W
Purchase Details
Closed on
Jun 12, 1979
Sold by
Jarvis A J
Bought by
Holmes Harry
Purchase Details
Closed on
May 26, 1978
Bought by
Jarvis A J
Create a Home Valuation Report for This Property
The Home Valuation Report is an in-depth analysis detailing your home's value as well as a comparison with similar homes in the area
Home Values in the Area
Average Home Value in this Area
Purchase History
| Date | Buyer | Sale Price | Title Company |
|---|---|---|---|
| Register Jeffrey T | $282,500 | -- | |
| Belcher Paul E | $252,000 | -- | |
| Hughes Warren Ray | -- | -- | |
| Hughes Warren Ray | $159,000 | -- | |
| Correct Error On Plat | -- | -- | |
| Shiels Richard W | $150,000 | -- | |
| Holmes Harry | $51,000 | -- | |
| Jarvis A J | $25,000 | -- |
Source: Public Records
Mortgage History
| Date | Status | Borrower | Loan Amount |
|---|---|---|---|
| Open | Register Jeffrey T | $197,000 |
Source: Public Records
Tax History Compared to Growth
Tax History
| Year | Tax Paid | Tax Assessment Tax Assessment Total Assessment is a certain percentage of the fair market value that is determined by local assessors to be the total taxable value of land and additions on the property. | Land | Improvement |
|---|---|---|---|---|
| 2025 | $4,433 | $171,428 | $79,042 | $92,386 |
| 2024 | $4,433 | $163,737 | $79,042 | $84,695 |
| 2023 | $4,032 | $143,574 | $79,042 | $64,532 |
| 2022 | $3,394 | $120,865 | $59,282 | $61,583 |
| 2021 | $3,312 | $111,693 | $59,282 | $52,411 |
| 2020 | $3,317 | $111,693 | $59,282 | $52,411 |
| 2019 | $3,296 | $111,693 | $59,282 | $52,411 |
| 2018 | $3,179 | $103,817 | $63,776 | $40,041 |
| 2017 | $3,193 | $103,817 | $63,776 | $40,041 |
| 2016 | $3,188 | $103,817 | $63,776 | $40,041 |
| 2015 | -- | $103,816 | $63,776 | $40,041 |
| 2014 | -- | $103,816 | $63,776 | $40,041 |
| 2013 | -- | $103,816 | $63,775 | $40,040 |
Source: Public Records
Map
Nearby Homes
- 241 Valhalla Rd Lot 1
- 0 Valhalla Rd S Unit 138510
- 241 Valhalla Rd S Unit LOT 1
- 241 Valhalla Rd S Unit LOT 4
- 241 Valhalla Rd S Unit LOT 2
- 241 Valhalla Rd S Unit LOT 3
- 0 the Retreat at Valhalla N
- 132 Valhalla Rd S
- 117 N Valhalla Ln
- 177 N Valhalla Dr
- 120 Valhalla Rd
- 118 Valhalla Rd S
- 126 N Valhalla Dr
- 2 Valhalla Rd S
- 4 Valhalla Rd S
- 3 Valhalla Rd S
- 114 N Valhalla Dr
- 100 Valhalla
- 0 Cannon Branch Rd Unit 179188
- 0 Cannon Branch Rd Unit 10635232
- 234 Valhalla Rd
- 242 Valhalla Rd
- 242 Valhalla Rd
- 232 Valhalla Rd
- 248 Valhalla Rd
- 230 Valhalla Rd
- 250 Valhalla Rd
- 228 Valhalla Rd
- 243 Valhalla Rd
- 226 Valhalla Rd
- 254 Valhalla Rd Unit 7
- 254 Valhalla Rd
- 254 Valhalla Rd
- 254 Valhalla Rd Unit A
- 254 Valhalla Rd Unit B
- 254 Valhalla Rd Unit F
- 254 Valhalla Rd Unit J
- 254 Valhalla Rd Unit I
- 254 Valhalla Rd Unit H
- 254 Valhalla Rd Unit G