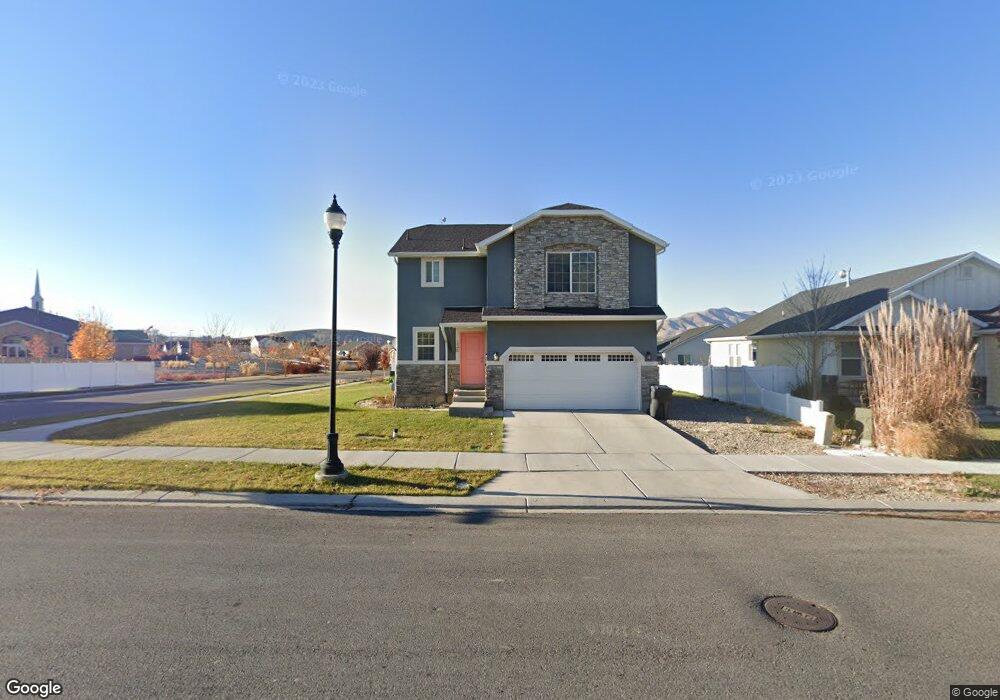
238 W Royal Land Dr Unit 11 Santaquin, UT 84655
Estimated Value: $468,000 - $540,000
3
Beds
3
Baths
1,560
Sq Ft
$317/Sq Ft
Est. Value
About This Home
This home is located at 238 W Royal Land Dr Unit 11, Santaquin, UT 84655 and is currently estimated at $495,136, approximately $317 per square foot. 238 W Royal Land Dr Unit 11 is a home located in Utah County with nearby schools including Apple Valley Elementary, Payson Junior High School, and Payson High School.
Ownership History
Date
Name
Owned For
Owner Type
Purchase Details
Closed on
May 16, 2016
Sold by
Utah Custom Homes Llc
Bought by
Nieffenegger Zachary and Nieffenegger Kimberly A
Current Estimated Value
Home Financials for this Owner
Home Financials are based on the most recent Mortgage that was taken out on this home.
Original Mortgage
$215,750
Interest Rate
3.58%
Mortgage Type
New Conventional
Create a Home Valuation Report for This Property
The Home Valuation Report is an in-depth analysis detailing your home's value as well as a comparison with similar homes in the area
Home Values in the Area
Average Home Value in this Area
Purchase History
| Date | Buyer | Sale Price | Title Company |
|---|---|---|---|
| Nieffenegger Zachary | -- | Provo Land Title Co | |
| Nieffenegger Zachary | -- | Provo Land Title Co | |
| Utah Custom Homes Llc | -- | Provo Land Title Co | |
| Utah Custom Homes Llc | -- | Provo Land Title Co |
Source: Public Records
Mortgage History
| Date | Status | Borrower | Loan Amount |
|---|---|---|---|
| Previous Owner | Utah Custom Homes Llc | $215,750 |
Source: Public Records
Tax History Compared to Growth
Tax History
| Year | Tax Paid | Tax Assessment Tax Assessment Total Assessment is a certain percentage of the fair market value that is determined by local assessors to be the total taxable value of land and additions on the property. | Land | Improvement |
|---|---|---|---|---|
| 2025 | $2,065 | $231,825 | $138,700 | $282,800 |
| 2024 | $2,065 | $205,590 | $0 | $0 |
| 2023 | $2,163 | $216,095 | $0 | $0 |
| 2022 | $2,178 | $224,400 | $0 | $0 |
| 2021 | $1,859 | $297,000 | $78,200 | $218,800 |
| 2020 | $1,786 | $276,400 | $68,000 | $208,400 |
| 2019 | $1,574 | $249,200 | $68,000 | $181,200 |
| 2018 | $1,438 | $217,000 | $59,400 | $157,600 |
| 2017 | $1,385 | $111,705 | $0 | $0 |
| 2016 | $516 | $40,800 | $0 | $0 |
| 2015 | $462 | $35,800 | $0 | $0 |
| 2014 | $490 | $37,900 | $0 | $0 |
Source: Public Records
Map
Nearby Homes
- 951 N 215 W
- 949 N 215 W
- 947 N 215 W
- 953 N 215 W
- 931 N 215 W
- 910 N 260 W
- 358 W 910 N
- McIntosh Plan at The Orchards
- Honey Plan at The Orchards
- Cranford Plan at The Orchards
- Monroe Plan at The Orchards
- Benson Plan at The Orchards
- Gala Plan at The Orchards
- 109 W 930 N
- 894 N Apple Seed Ln
- 162 W 690 N
- 41 W 770 N
- 1032 N Apple Seed Ln
- 116 E 840 N
- 961 N 120 E
- 328 W Royal Land Dr
- 230 W Royal Land Dr
- 226 W Royal Land Dr
- 302 W Royal Land Dr Unit 10
- 297 W Braeburn Ln
- 273 W Braeburn Ln
- 214 W Royal Land Dr Unit 35
- 885 N 210 W Unit 32
- 852 N 240 W
- 306 W Royal Land Dr Unit 9
- 855 N 240 W
- 263 W Braeburn Ln Unit 4
- 210 W Royal Land Dr
- 875 N 210 W
- 257 W Braeburn Ln
- 844 N 240 W Unit 14
- 845 N 240 W
- 310 W Royal Land Dr Unit 8
- 867 N 210 W
- 292 W Braeburn Ln