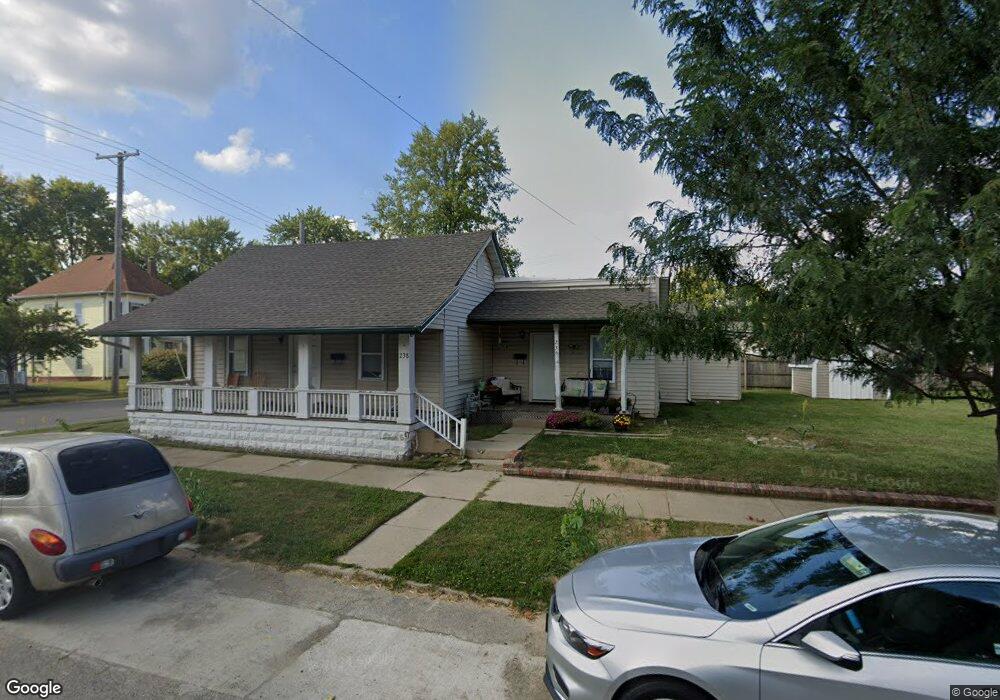
238 W South St Greenfield, IN 46140
Estimated Value: $90,000 - $240,000
4
Beds
2
Baths
1,640
Sq Ft
$102/Sq Ft
Est. Value
About This Home
This home is located at 238 W South St, Greenfield, IN 46140 and is currently estimated at $166,556, approximately $101 per square foot. 238 W South St is a home located in Hancock County with nearby schools including Greenfield Intermediate School, Harris Elementary School, and Greenfield Central Junior High School.
Ownership History
Date
Name
Owned For
Owner Type
Purchase Details
Closed on
Mar 18, 2020
Sold by
Brackenridge Dennis
Bought by
Love Indy Llc
Current Estimated Value
Purchase Details
Closed on
Apr 7, 2015
Sold by
First Horizon Home Loans
Bought by
Brackenridge Dennis
Purchase Details
Closed on
Jul 30, 2014
Sold by
Lyon David M
Bought by
First Horizon Home Loans
Purchase Details
Closed on
Jun 29, 2006
Sold by
J A K Properties Llc
Bought by
Lyon David M and Lyon Nichole L
Home Financials for this Owner
Home Financials are based on the most recent Mortgage that was taken out on this home.
Original Mortgage
$70,800
Interest Rate
8.5%
Mortgage Type
Adjustable Rate Mortgage/ARM
Purchase Details
Closed on
Mar 22, 2005
Sold by
The Bank Of New York
Bought by
Jak Properties Llc
Purchase Details
Closed on
Jan 26, 2005
Sold by
Huffman Gary L
Bought by
The Bank Of New York
Create a Home Valuation Report for This Property
The Home Valuation Report is an in-depth analysis detailing your home's value as well as a comparison with similar homes in the area
Home Values in the Area
Average Home Value in this Area
Purchase History
| Date | Buyer | Sale Price | Title Company |
|---|---|---|---|
| Love Indy Llc | -- | None Available | |
| Brackenridge Dennis | -- | None Available | |
| First Horizon Home Loans | -- | First Amencan Title Ins | |
| Lyon David M | -- | -- | |
| Jak Properties Llc | -- | -- | |
| The Bank Of New York | $36,002 | -- |
Source: Public Records
Mortgage History
| Date | Status | Borrower | Loan Amount |
|---|---|---|---|
| Previous Owner | Lyon David M | $70,800 |
Source: Public Records
Tax History Compared to Growth
Tax History
| Year | Tax Paid | Tax Assessment Tax Assessment Total Assessment is a certain percentage of the fair market value that is determined by local assessors to be the total taxable value of land and additions on the property. | Land | Improvement |
|---|---|---|---|---|
| 2024 | $2,084 | $104,200 | $30,000 | $74,200 |
| 2023 | $2,084 | $94,300 | $30,000 | $64,300 |
| 2022 | $1,500 | $75,000 | $24,900 | $50,100 |
| 2021 | $1,288 | $64,400 | $24,900 | $39,500 |
| 2020 | $1,262 | $63,100 | $24,900 | $38,200 |
| 2019 | $1,202 | $60,100 | $24,900 | $35,200 |
| 2018 | $1,206 | $60,300 | $24,900 | $35,400 |
| 2017 | $1,184 | $59,200 | $24,900 | $34,300 |
| 2016 | $1,150 | $57,500 | $24,200 | $33,300 |
| 2014 | $1,626 | $81,300 | $23,900 | $57,400 |
| 2013 | $1,626 | $79,600 | $23,900 | $55,700 |
Source: Public Records
Map
Nearby Homes
- 3840 Highway 40 W
- 433 W Main St
- 303 Walnut St
- 238 Walnut St
- 0 S State St Unit MBR22005177
- 0 N Sr 9 Unit MBR21970587
- 121 School St
- 419 W Osage St
- 400 S Pennsylvania St
- 202 N State St
- 18 Hough St
- 425 S Pennsylvania St
- 104 E North St
- 514 Riley Ave
- 507 S Pennsylvania St
- 505 W Pierson St
- 218 E North St
- 404 N State St
- 421 N State St
- 111 Tague St