Estimated Value: $402,000 - $450,000
5
Beds
3
Baths
2,436
Sq Ft
$176/Sq Ft
Est. Value
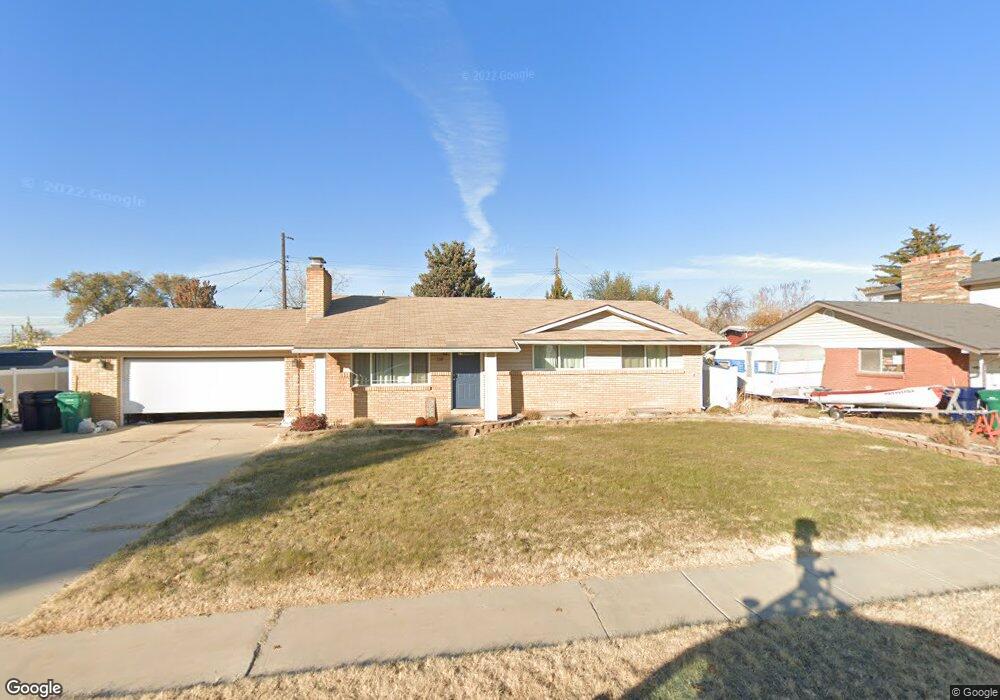
About This Home
This home is located at 2380 W 4900 S, Roy, UT 84067 and is currently estimated at $428,905, approximately $176 per square foot. 2380 W 4900 S is a home located in Weber County with nearby schools including Lakeview Elementary School, Roy Junior High School, and Roy High School.
Ownership History
Date
Name
Owned For
Owner Type
Purchase Details
Closed on
Aug 31, 2022
Sold by
Martin Jackson R
Bought by
Hillside View Llc
Current Estimated Value
Purchase Details
Closed on
Nov 4, 2020
Sold by
Martin Brittany A
Bought by
Martin Jackson R
Purchase Details
Closed on
Mar 19, 2019
Sold by
Armstrong Justin
Bought by
Martin Jackson R and Martin Brittany A
Purchase Details
Closed on
Dec 3, 1996
Sold by
Anderson Dawn A
Bought by
Anderson Steven E
Create a Home Valuation Report for This Property
The Home Valuation Report is an in-depth analysis detailing your home's value as well as a comparison with similar homes in the area
Home Values in the Area
Average Home Value in this Area
Purchase History
| Date | Buyer | Sale Price | Title Company |
|---|---|---|---|
| Hillside View Llc | -- | -- | |
| Martin Jackson R | -- | Hickman Land Title Layton | |
| Martin Jackson R | -- | Hickman Land Title Layton | |
| Anderson Steven E | -- | -- |
Source: Public Records
Tax History
| Year | Tax Paid | Tax Assessment Tax Assessment Total Assessment is a certain percentage of the fair market value that is determined by local assessors to be the total taxable value of land and additions on the property. | Land | Improvement |
|---|---|---|---|---|
| 2025 | $2,652 | $420,985 | $120,000 | $300,985 |
| 2024 | $2,516 | $401,000 | $120,001 | $280,999 |
| 2023 | $2,391 | $381,000 | $114,824 | $266,176 |
| 2022 | $2,644 | $438,000 | $105,008 | $332,992 |
| 2021 | $2,028 | $301,000 | $69,994 | $231,006 |
| 2020 | $1,841 | $250,000 | $69,994 | $180,006 |
| 2019 | $1,799 | $230,000 | $40,019 | $189,981 |
| 2018 | $1,633 | $195,000 | $37,012 | $157,988 |
| 2017 | $1,525 | $170,000 | $37,012 | $132,988 |
| 2016 | $1,444 | $86,293 | $19,021 | $67,272 |
| 2015 | $1,335 | $81,328 | $19,021 | $62,307 |
| 2014 | $1,251 | $74,664 | $16,160 | $58,504 |
Source: Public Records
Map
Nearby Homes
Your Personal Tour Guide
Ask me questions while you tour the home.