Estimated Value: $101,000 - $232,000
1
Bed
1
Bath
612
Sq Ft
$270/Sq Ft
Est. Value
About This Home
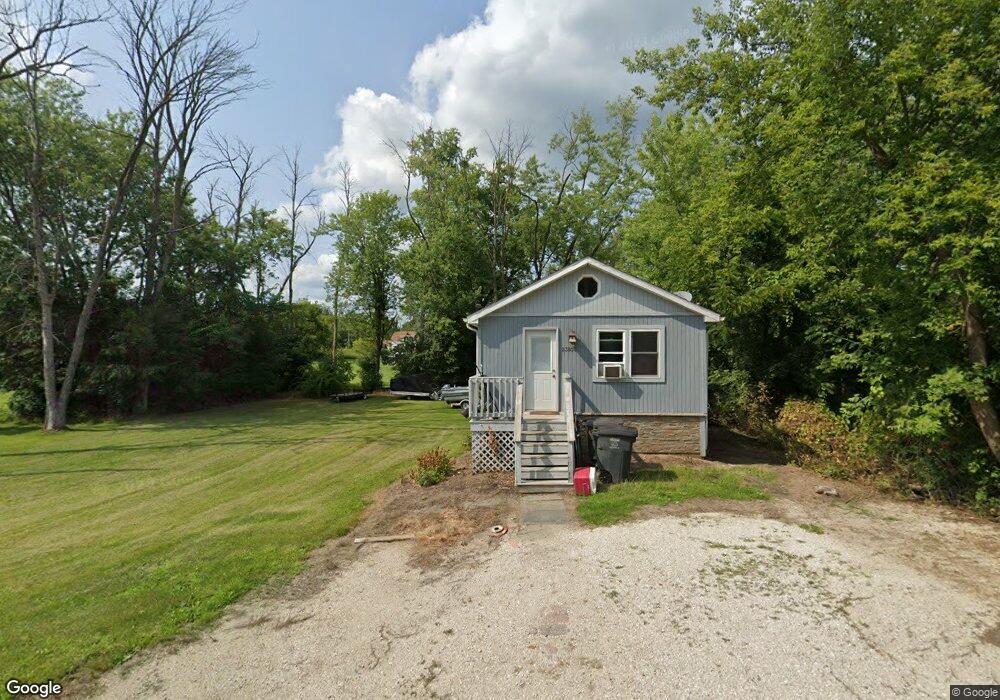
This home is located at 23802 61st St, Salem, WI 53168 and is currently estimated at $165,395, approximately $270 per square foot. 23802 61st St is a home located in Kenosha County with nearby schools including Salem Elementary School and Central High School.
Ownership History
Date
Name
Owned For
Owner Type
Purchase Details
Closed on
Jan 28, 2014
Sold by
Stonegate Mortgage Corporation
Bought by
The Sec Of Housing & Urban Development
Current Estimated Value
Purchase Details
Closed on
Nov 6, 2013
Sold by
Kline Kathleen
Bought by
Stonegate Mortgage Corporation
Purchase Details
Closed on
May 17, 2010
Sold by
Harmon Sheila A
Bought by
Kline Kathleen A
Purchase Details
Closed on
Mar 7, 2008
Sold by
Fannie Mae
Bought by
Harmon Sheila A
Purchase Details
Closed on
Jun 27, 2007
Sold by
Whiddon William M
Bought by
Federal National Mortgage Association
Create a Home Valuation Report for This Property
The Home Valuation Report is an in-depth analysis detailing your home's value as well as a comparison with similar homes in the area
Home Values in the Area
Average Home Value in this Area
Purchase History
| Date | Buyer | Sale Price | Title Company |
|---|---|---|---|
| The Sec Of Housing & Urban Development | $80,800 | -- | |
| Stonegate Mortgage Corporation | $95,900 | -- | |
| Kline Kathleen A | $84,000 | -- | |
| Harmon Sheila A | $52,000 | -- | |
| Federal National Mortgage Association | $92,400 | -- |
Source: Public Records
Tax History Compared to Growth
Tax History
| Year | Tax Paid | Tax Assessment Tax Assessment Total Assessment is a certain percentage of the fair market value that is determined by local assessors to be the total taxable value of land and additions on the property. | Land | Improvement |
|---|---|---|---|---|
| 2024 | $1,541 | $106,000 | $27,500 | $78,500 |
| 2023 | $1,330 | $106,000 | $27,500 | $78,500 |
| 2022 | $1,363 | $79,200 | $21,500 | $57,700 |
| 2021 | $1,236 | $79,200 | $21,500 | $57,700 |
| 2020 | $1,236 | $62,000 | $16,000 | $46,000 |
| 2019 | $1,231 | $62,000 | $16,000 | $46,000 |
| 2018 | $1,423 | $62,000 | $16,000 | $46,000 |
| 2017 | $1,215 | $54,600 | $16,000 | $38,600 |
| 2016 | $1,427 | $54,600 | $16,000 | $38,600 |
| 2015 | $1,205 | $54,600 | $16,000 | $38,600 |
| 2014 | $2,530 | $54,600 | $16,000 | $38,600 |
Source: Public Records
Map
Nearby Homes