S
Landlord's Agent in 2020
Sally Ratliff
All City Real Estate
(281) 723-7000
4 in this area
28 Total Sales
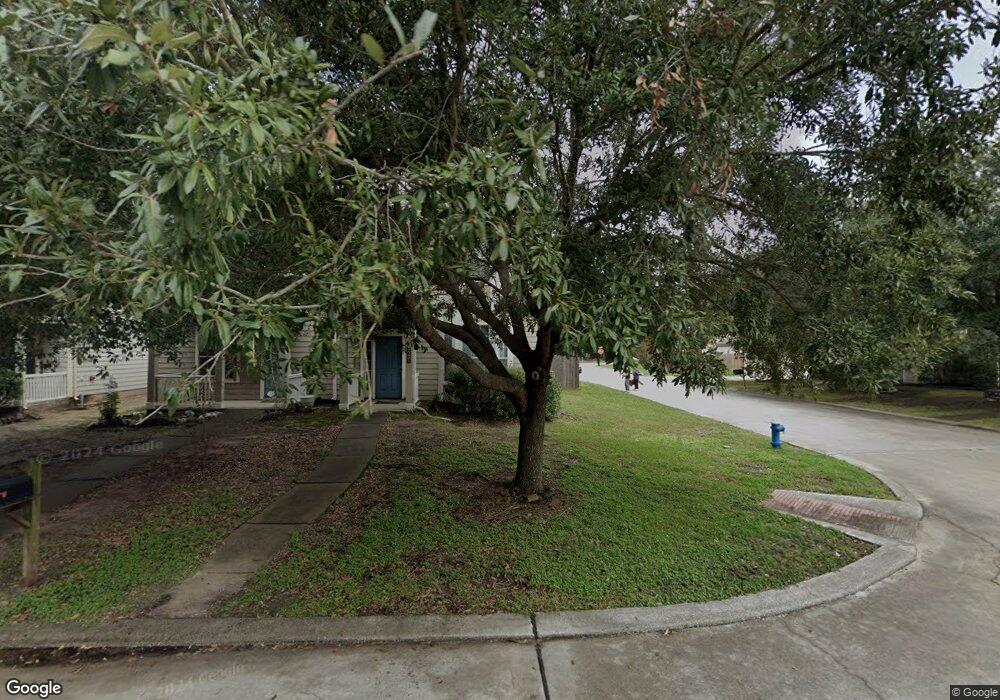

Estimated Value: $181,967 - $193,000
Great house...recent tile downstairs...House is clean and ready for move in..Corner lot..Lots of parking and 2 car garage in back of house...Owner /agent
Last Agent to Rent the Property
All City Real Estate License #0549953 Listed on: 04/21/2020

| Date | Buyer | Sale Price | Title Company |
|---|---|---|---|
| Ratliff Sally | -- | None Available | |
| The Secretary Of Housing & Urban Develop | -- | None Available | |
| Chase Home Finance Llc | $107,219 | None Available | |
| Peters Ginger Anne | -- | First American Title |
| Date | Status | Borrower | Loan Amount |
|---|---|---|---|
| Previous Owner | Peters Ginger Anne | $101,575 |
| Date | Event | Price | List to Sale | Price per Sq Ft |
|---|---|---|---|---|
| 05/05/2025 05/05/25 | Off Market | $1,325 | -- | -- |
| 12/30/2021 12/30/21 | Off Market | $1,350 | -- | -- |
| 05/08/2020 05/08/20 | Rented | $1,325 | -5.0% | -- |
| 04/21/2020 04/21/20 | For Rent | $1,395 | +5.3% | -- |
| 04/21/2020 04/21/20 | Rented | $1,325 | -1.9% | -- |
| 08/31/2018 08/31/18 | Rented | $1,350 | 0.0% | -- |
| 08/11/2018 08/11/18 | For Rent | $1,350 | 0.0% | -- |
| 08/11/2018 08/11/18 | Rented | $1,350 | +8.0% | -- |
| 08/09/2017 08/09/17 | Rented | $1,250 | 0.0% | -- |
| 08/09/2017 08/09/17 | For Rent | $1,250 | -- | -- |
| Year | Tax Paid | Tax Assessment Tax Assessment Total Assessment is a certain percentage of the fair market value that is determined by local assessors to be the total taxable value of land and additions on the property. | Land | Improvement |
|---|---|---|---|---|
| 2025 | $5,258 | $175,779 | $32,900 | $142,879 |
| 2024 | $5,258 | $190,002 | $32,900 | $157,102 |
| 2023 | $5,258 | $214,456 | $32,900 | $181,556 |
| 2022 | $5,281 | $173,705 | $28,769 | $144,936 |
| 2021 | $4,626 | $152,849 | $14,754 | $138,095 |
| 2020 | $4,308 | $135,545 | $14,754 | $120,791 |
| 2019 | $4,375 | $132,584 | $14,754 | $117,830 |
| 2018 | $3,695 | $111,853 | $11,213 | $100,640 |
| 2017 | $3,915 | $119,793 | $11,213 | $108,580 |
| 2016 | $3,560 | $108,933 | $11,213 | $97,720 |
| 2015 | $2,636 | $99,619 | $11,213 | $88,406 |
| 2014 | $2,636 | $86,871 | $11,213 | $75,658 |
S
Landlord's Agent in 2020
Sally Ratliff
All City Real Estate
(281) 723-7000
4 in this area
28 Total Sales
Tenant's Agent in 2020
Andrea Long
Longevity Real Estate
(713) 384-2475
1 in this area
36 Total Sales
D
Buyer's Agent in 2017
David Hofstra
All City Real Estate
(936) 525-3200
Source: Houston Association of REALTORS®
MLS Number: 62727483
APN: 1255380030014
Disclaimer: Certain information contained herein is derived from information provided by parties other than Homes.com. All information provided is deemed reliable, but is not guaranteed to be accurate and should be independently verified.
![]() Copyright 2026, Houston REALTORS® Information Service, Inc.
Copyright 2026, Houston REALTORS® Information Service, Inc.
The information provided is exclusively for consumers’ personal, non-commercial use, and may not be used for any purpose other than to identify prospective properties consumers may be interested in purchasing.
Information is deemed reliable but not guaranteed.
Ask me questions while you tour the home.