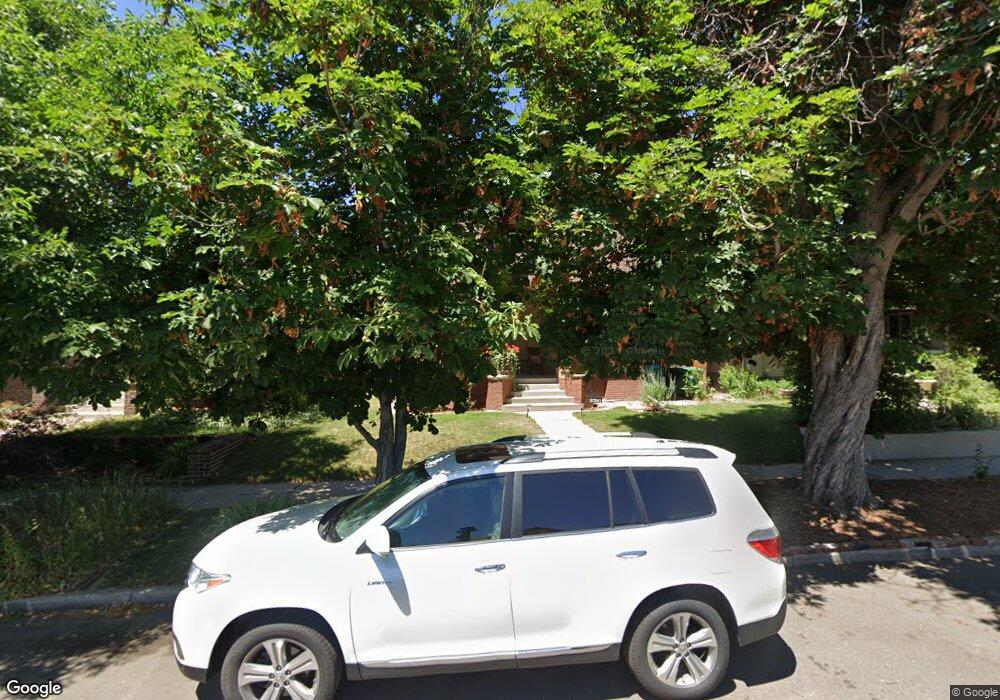
2381 Clermont St Denver, CO 80207
North Park Hill NeighborhoodEstimated Value: $599,226 - $755,000
2
Beds
1
Bath
1,078
Sq Ft
$615/Sq Ft
Est. Value
About This Home
This home is located at 2381 Clermont St, Denver, CO 80207 and is currently estimated at $662,807, approximately $614 per square foot. 2381 Clermont St is a home located in Denver County with nearby schools including Stedman Elementary School, William (Bill) Roberts ECE-8 School, and McAuliffe International School.
Ownership History
Date
Name
Owned For
Owner Type
Purchase Details
Closed on
Oct 29, 2020
Sold by
Sieg Diane
Bought by
Sieg Diane and Funsch Neil E
Current Estimated Value
Home Financials for this Owner
Home Financials are based on the most recent Mortgage that was taken out on this home.
Original Mortgage
$240,000
Outstanding Balance
$206,070
Interest Rate
2.9%
Mortgage Type
New Conventional
Estimated Equity
$456,737
Purchase Details
Closed on
Jul 25, 2008
Sold by
Cook James A
Bought by
Sieg Diane
Home Financials for this Owner
Home Financials are based on the most recent Mortgage that was taken out on this home.
Original Mortgage
$236,250
Interest Rate
6.4%
Mortgage Type
Purchase Money Mortgage
Purchase Details
Closed on
May 20, 2005
Sold by
Boll Dawn M
Bought by
Cook James A
Home Financials for this Owner
Home Financials are based on the most recent Mortgage that was taken out on this home.
Original Mortgage
$217,400
Interest Rate
5.87%
Mortgage Type
Fannie Mae Freddie Mac
Purchase Details
Closed on
Jan 28, 1998
Sold by
Olson Scott W and Olson Dawn M
Bought by
Boll Dawn M
Create a Home Valuation Report for This Property
The Home Valuation Report is an in-depth analysis detailing your home's value as well as a comparison with similar homes in the area
Home Values in the Area
Average Home Value in this Area
Purchase History
| Date | Buyer | Sale Price | Title Company |
|---|---|---|---|
| Sieg Diane | -- | Heritage Title Company | |
| Sieg Diane | $315,000 | Land Title | |
| Cook James A | $280,700 | Fahtco | |
| Boll Dawn M | -- | -- |
Source: Public Records
Mortgage History
| Date | Status | Borrower | Loan Amount |
|---|---|---|---|
| Open | Sieg Diane | $240,000 | |
| Closed | Sieg Diane | $236,250 | |
| Previous Owner | Cook James A | $217,400 | |
| Closed | Cook James A | $49,250 |
Source: Public Records
Tax History Compared to Growth
Tax History
| Year | Tax Paid | Tax Assessment Tax Assessment Total Assessment is a certain percentage of the fair market value that is determined by local assessors to be the total taxable value of land and additions on the property. | Land | Improvement |
|---|---|---|---|---|
| 2024 | $2,983 | $37,660 | $20,980 | $16,680 |
| 2023 | $2,918 | $37,660 | $20,980 | $16,680 |
| 2022 | $2,488 | $31,290 | $24,080 | $7,210 |
| 2021 | $2,488 | $32,180 | $24,770 | $7,410 |
| 2020 | $2,391 | $32,230 | $21,680 | $10,550 |
| 2019 | $2,324 | $32,230 | $21,680 | $10,550 |
| 2018 | $2,221 | $28,710 | $13,260 | $15,450 |
| 2017 | $2,215 | $28,710 | $13,260 | $15,450 |
| 2016 | $2,040 | $25,020 | $13,795 | $11,225 |
| 2015 | $1,955 | $25,020 | $13,795 | $11,225 |
| 2014 | $1,869 | $22,500 | $12,067 | $10,433 |
Source: Public Records
Map
Nearby Homes
- 2342 Dexter St
- 2645 Cherry St
- 2090 Bellaire St
- 2600 Colorado Blvd
- 2541 Elm St
- 2827 Bellaire St
- 4535 E Montview Blvd
- 3993 Haddon Rd
- 2676 Elm St
- 2645 Fairfax St
- 2812 Harrison St
- 2289 N Glencoe St
- 2664 Forest St
- 1150-60 N Dahlia St
- 1160 N Dahlia St
- 2870 Forest St
- 4305 E 17th Avenue Pkwy
- 4621 E 17th Avenue Pkwy
- 2919 Forest St
- 3070 Cherry St
- 2377 Clermont St
- 2395 Clermont St
- 2371 Clermont St
- 2363 Clermont St
- 2378 Birch St
- 2380 Birch St
- 2382 Clermont St
- 2376 Clermont St
- 2390 Clermont St
- 2390 Birch St
- 2368 Birch St
- 2370 Clermont St
- 2505 Clermont St
- 2364 Clermont St
- 2349 Clermont St Unit 2355
- 2364 Birch St
- 2500 Clermont St
- 2356 Clermont St
- 2509 Clermont St
- 2360 Birch St