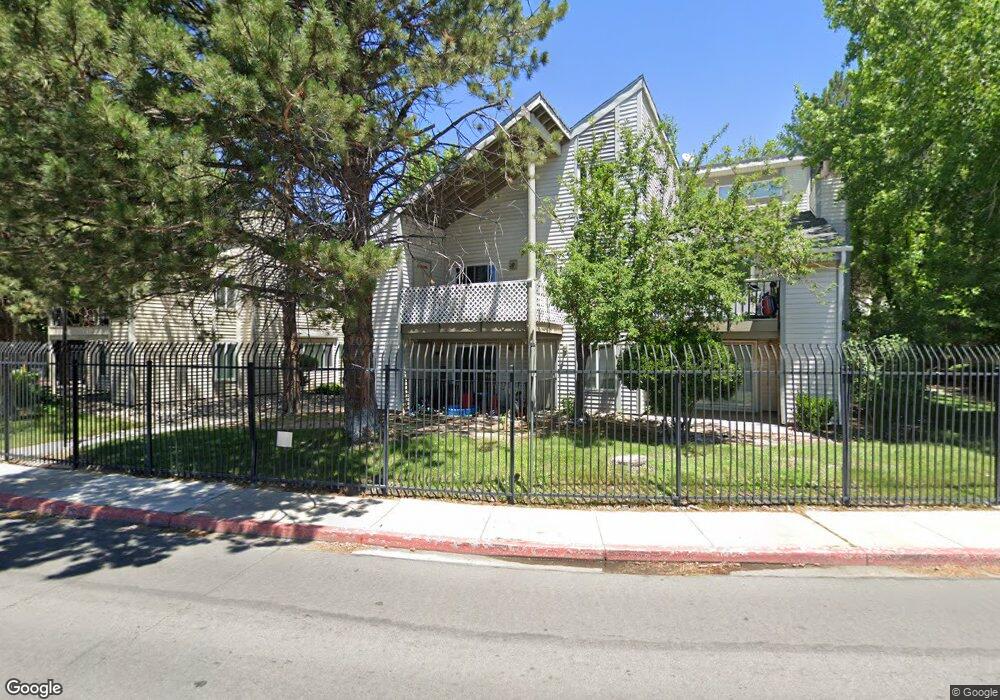
2381 Roundhouse Rd Sparks, NV 89431
Downtown Sparks NeighborhoodEstimated Value: $172,000 - $354,000
1
Bed
1
Bath
786
Sq Ft
$290/Sq Ft
Est. Value
About This Home
This home is located at 2381 Roundhouse Rd, Sparks, NV 89431 and is currently estimated at $227,950, approximately $290 per square foot. 2381 Roundhouse Rd is a home located in Washoe County with nearby schools including Kate M Smith Elementary School, Sparks Middle School, and Sparks High School.
Ownership History
Date
Name
Owned For
Owner Type
Purchase Details
Closed on
Sep 1, 2022
Sold by
Jan Skinner Alana
Bought by
Talonen Stacey
Current Estimated Value
Purchase Details
Closed on
Dec 20, 2019
Sold by
Rosenberg Eric and Kato Terumi
Bought by
Skinner Alana
Purchase Details
Closed on
Dec 2, 2013
Sold by
Clark Lloyd A and Clark Joan D
Bought by
Bautista Carmelito P and Bautista Cynthia M
Purchase Details
Closed on
Jul 29, 2004
Sold by
Marble Noell
Bought by
Rosenberg Eric and Kato Terumi
Home Financials for this Owner
Home Financials are based on the most recent Mortgage that was taken out on this home.
Original Mortgage
$72,000
Interest Rate
6.29%
Mortgage Type
Seller Take Back
Purchase Details
Closed on
Feb 14, 1997
Sold by
Marble Noell and Marble Patricia
Bought by
Marble Noell and Marble Patricia
Create a Home Valuation Report for This Property
The Home Valuation Report is an in-depth analysis detailing your home's value as well as a comparison with similar homes in the area
Home Values in the Area
Average Home Value in this Area
Purchase History
| Date | Buyer | Sale Price | Title Company |
|---|---|---|---|
| Talonen Stacey | -- | -- | |
| Skinner Alana | $139,900 | Toiyabe Title | |
| Bautista Carmelito P | $66,000 | None Available | |
| Rosenberg Eric | $80,000 | Western Title Incorporated | |
| Marble Noell | -- | -- |
Source: Public Records
Mortgage History
| Date | Status | Borrower | Loan Amount |
|---|---|---|---|
| Previous Owner | Rosenberg Eric | $72,000 |
Source: Public Records
Tax History Compared to Growth
Tax History
| Year | Tax Paid | Tax Assessment Tax Assessment Total Assessment is a certain percentage of the fair market value that is determined by local assessors to be the total taxable value of land and additions on the property. | Land | Improvement |
|---|---|---|---|---|
| 2025 | $565 | $30,616 | $14,490 | $16,126 |
| 2024 | $565 | $31,515 | $14,490 | $17,025 |
| 2023 | $523 | $28,978 | $13,650 | $15,328 |
| 2022 | $487 | $24,696 | $11,375 | $13,321 |
| 2021 | $450 | $22,670 | $9,170 | $13,500 |
| 2020 | $433 | $23,029 | $9,170 | $13,859 |
| 2019 | $413 | $20,469 | $6,685 | $13,784 |
| 2018 | $395 | $17,082 | $4,445 | $12,637 |
| 2017 | $382 | $17,118 | $4,375 | $12,743 |
| 2016 | $374 | $17,463 | $4,130 | $13,333 |
| 2015 | $281 | $15,888 | $2,800 | $13,088 |
| 2014 | $361 | $11,028 | $2,450 | $8,578 |
| 2013 | -- | $9,439 | $1,575 | $7,864 |
Source: Public Records
Map
Nearby Homes
- 2385 Roundhouse Rd Unit N1
- 2383 Roundhouse Rd
- 2379 Roundhouse Rd
- 2389 Roundhouse Rd Unit D
- 2393 Roundhouse Rd
- 2391 Roundhouse Rd Unit C
- 2387 Roundhouse Rd Unit A
- 2373 Roundhouse Rd
- 2377 Roundhouse Rd
- 2375 Roundhouse Rd
- 2371 Roundhouse Rd
- 2384 Roundhouse Rd Unit C
- 2382 Roundhouse Rd
- 2367 Roundhouse Rd
- 2363 Roundhouse Rd
- 2365 Roundhouse Rd Unit P1R
- 2359 Roundhouse Rd
- 2355 Roundhouse Rd
- 2347 Roundhouse Rd
- 2351 Roundhouse Rd