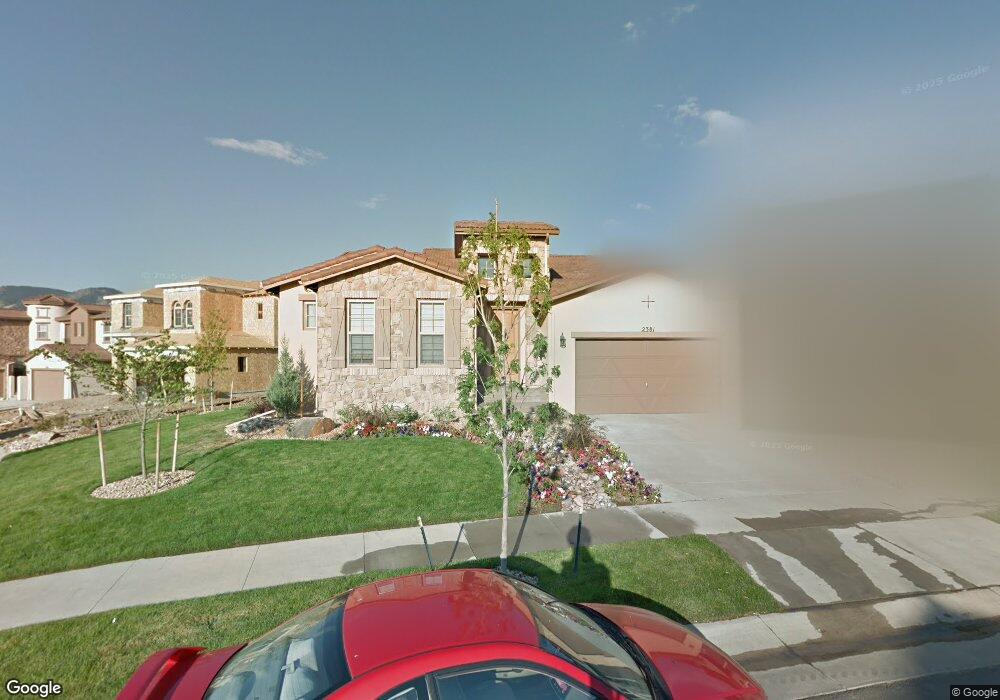
2381 S Lupine St Denver, CO 80228
Rooney Valley NeighborhoodEstimated Value: $1,212,000 - $1,278,000
5
Beds
3
Baths
4,077
Sq Ft
$306/Sq Ft
Est. Value
About This Home
This home is located at 2381 S Lupine St, Denver, CO 80228 and is currently estimated at $1,247,782, approximately $306 per square foot. 2381 S Lupine St is a home located in Jefferson County with nearby schools including Rooney Ranch Elementary School, Dunstan Middle School, and Green Mountain High School.
Ownership History
Date
Name
Owned For
Owner Type
Purchase Details
Closed on
Jun 8, 2016
Sold by
Long Philip A and Long Rhonda L
Bought by
Miller Daniel S and Nightengale Alice L
Current Estimated Value
Home Financials for this Owner
Home Financials are based on the most recent Mortgage that was taken out on this home.
Original Mortgage
$317,750
Outstanding Balance
$253,633
Interest Rate
3.66%
Mortgage Type
Commercial
Estimated Equity
$994,149
Purchase Details
Closed on
Jan 24, 2012
Sold by
Cardel Home U S Limited Partnership
Bought by
Long Philip A and Long Rhonda L
Home Financials for this Owner
Home Financials are based on the most recent Mortgage that was taken out on this home.
Original Mortgage
$417,000
Interest Rate
4%
Mortgage Type
New Conventional
Purchase Details
Closed on
Sep 21, 2011
Sold by
Solterra Llc
Bought by
Cardel Homes U S Limited Partnership
Create a Home Valuation Report for This Property
The Home Valuation Report is an in-depth analysis detailing your home's value as well as a comparison with similar homes in the area
Home Values in the Area
Average Home Value in this Area
Purchase History
| Date | Buyer | Sale Price | Title Company |
|---|---|---|---|
| Miller Daniel S | $742,000 | Land Title Guarantee Company | |
| Long Philip A | $529,836 | Land Title Guarantee Company | |
| Cardel Homes U S Limited Partnership | $112,200 | Land Title Guarantee Company |
Source: Public Records
Mortgage History
| Date | Status | Borrower | Loan Amount |
|---|---|---|---|
| Open | Miller Daniel S | $317,750 | |
| Previous Owner | Long Philip A | $417,000 | |
| Closed | Cardel Homes U S Limited Partnership | $0 |
Source: Public Records
Tax History Compared to Growth
Tax History
| Year | Tax Paid | Tax Assessment Tax Assessment Total Assessment is a certain percentage of the fair market value that is determined by local assessors to be the total taxable value of land and additions on the property. | Land | Improvement |
|---|---|---|---|---|
| 2024 | $10,664 | $72,702 | $24,812 | $47,890 |
| 2023 | $10,664 | $72,702 | $24,812 | $47,890 |
| 2022 | $8,713 | $58,574 | $21,147 | $37,427 |
| 2021 | $8,926 | $60,260 | $21,756 | $38,504 |
| 2020 | $8,422 | $55,530 | $18,884 | $36,646 |
| 2019 | $8,617 | $55,530 | $18,884 | $36,646 |
| 2018 | $7,372 | $48,492 | $15,434 | $33,058 |
| 2017 | $7,116 | $48,492 | $15,434 | $33,058 |
| 2016 | $7,625 | $51,852 | $11,614 | $40,238 |
| 2015 | $7,209 | $51,852 | $11,614 | $40,238 |
| 2014 | $7,209 | $46,505 | $8,966 | $37,539 |
Source: Public Records
Map
Nearby Homes
- 15295 W Baker Ave
- 2347 S Loveland St
- 2385 S Loveland Way
- 15274 W La Salle Ave
- 15514 W La Salle Ave
- 15429 W Baltic Ave
- 2429 S Orchard St
- 2164 S Nile St
- 15569 W Baker Ave
- 15524 W Auburn Ave
- 15585 W La Salle Ave
- 15564 W Washburn Ave
- 15558 W Washburn Ave
- 15568 W Washburn Ave
- 15523 W Washburn Dr
- 15527 W Washburn Dr
- 15553 W Washburn Dr
- Cadence Eleven Plan at Cadence at Solterra - Cadence
- Cadence Twelve Plan at Cadence at Solterra - Cadence
- 15533 W Washburn Dr
- 2375 S Lupine St
- 2385 S Lupine St
- 2371 S Lupine St
- 2395 S Lupine St
- 2395 S Lupine St
- 15296 W Auburn Ave
- 2380 S Lupine St
- 2382 S Lupine Way
- 2388 S Lupine Way
- 2378 S Lupine Way
- 2361 S Lupine St
- 2376 S Lupine St
- 15295 W Auburn Ave
- 15288 W Auburn Ave
- 2392 S Lupine Way
- 2372 S Lupine Way
- 2355 S Lupine St
- 2366 S Lupine St
- 15285 W Auburn Ave
- 15278 W Auburn Ave