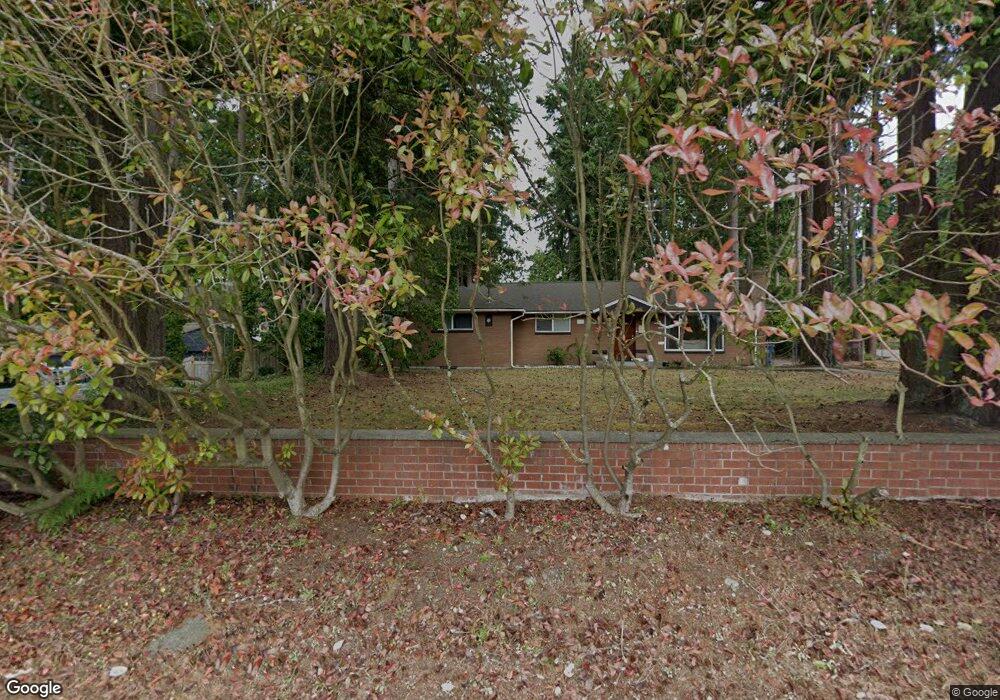
23817 104th Ave W Edmonds, WA 98020
Sherwood Forest NeighborhoodEstimated Value: $962,000 - $1,308,000
3
Beds
3
Baths
1,904
Sq Ft
$572/Sq Ft
Est. Value
About This Home
This home is located at 23817 104th Ave W, Edmonds, WA 98020 and is currently estimated at $1,089,446, approximately $572 per square foot. 23817 104th Ave W is a home located in Snohomish County with nearby schools including Sherwood Elementary School, College Place Middle School, and Edmonds-Woodway High School.
Ownership History
Date
Name
Owned For
Owner Type
Purchase Details
Closed on
May 8, 2014
Sold by
Spangler Linda
Bought by
Parrish Ryan Patrick and Parrish Aurora Porter
Current Estimated Value
Home Financials for this Owner
Home Financials are based on the most recent Mortgage that was taken out on this home.
Original Mortgage
$358,000
Outstanding Balance
$273,347
Interest Rate
4.38%
Mortgage Type
New Conventional
Estimated Equity
$816,099
Purchase Details
Closed on
Jul 16, 2010
Sold by
Spangler James
Bought by
Spangler Linda
Purchase Details
Closed on
Nov 22, 1996
Sold by
Carefree Homes Inc
Bought by
Spangler James S and Spangler Linda B
Home Financials for this Owner
Home Financials are based on the most recent Mortgage that was taken out on this home.
Original Mortgage
$172,000
Interest Rate
7.88%
Create a Home Valuation Report for This Property
The Home Valuation Report is an in-depth analysis detailing your home's value as well as a comparison with similar homes in the area
Home Values in the Area
Average Home Value in this Area
Purchase History
| Date | Buyer | Sale Price | Title Company |
|---|---|---|---|
| Parrish Ryan Patrick | $415,000 | Chicago Title | |
| Spangler Linda | -- | None Available | |
| Spangler James S | $215,000 | Chicago Title Ins Co |
Source: Public Records
Mortgage History
| Date | Status | Borrower | Loan Amount |
|---|---|---|---|
| Open | Parrish Ryan Patrick | $358,000 | |
| Previous Owner | Spangler James S | $172,000 |
Source: Public Records
Tax History Compared to Growth
Tax History
| Year | Tax Paid | Tax Assessment Tax Assessment Total Assessment is a certain percentage of the fair market value that is determined by local assessors to be the total taxable value of land and additions on the property. | Land | Improvement |
|---|---|---|---|---|
| 2025 | $5,970 | $854,800 | $548,200 | $306,600 |
| 2024 | $5,970 | $837,700 | $531,100 | $306,600 |
| 2023 | $6,251 | $909,000 | $554,800 | $354,200 |
| 2022 | $5,755 | $688,100 | $420,400 | $267,700 |
| 2020 | $5,509 | $589,100 | $330,200 | $258,900 |
| 2019 | $5,194 | $559,500 | $303,200 | $256,300 |
| 2018 | $5,234 | $487,200 | $258,500 | $228,700 |
| 2017 | $4,515 | $439,800 | $224,100 | $215,700 |
| 2016 | $4,194 | $404,700 | $198,100 | $206,600 |
| 2015 | $4,214 | $382,900 | $189,700 | $193,200 |
| 2013 | $3,353 | $287,200 | $128,300 | $158,900 |
Source: Public Records
Map
Nearby Homes
- 24012 102nd Place W
- 24104 105th Place W
- 24109 106th Place W
- 9906 242nd Place SW
- 11108 239th Place SW
- 9801 234th St SW Unit 1
- 23511 96th Ave W
- 20142 17th Ave NW
- 9526 234th St SW
- 23024 99th Ave W
- 20005 13th Place NW
- 11211 Wachusett Rd
- 303 NW 203rd St
- 11130 S Deer Dr
- 19811 11th Ave NW
- 11432 238th St SW
- 20130 21st Ave NW
- 20128 21st Ave NW
- 22628 106th Ave W
- 23227 92nd Ave W
- 23817 104th Ave W
- 23809 104th Ave W
- 10316 238th St SW
- 10310 238th St SW
- 23909 104th Ave W
- 23907 104th Ave W
- 23901 104th Ave W
- 23905 104th Ave W
- 10304 238th St SW
- 23903 104th Ave W
- 23911 104th Ave W
- 0 xxx 238th St SW
- 0 238th St SW
- 10319 238th St SW
- 23727 104th Ave W
- 23913 104th Ave W
- 23919 104th Ave W
- 23726 102nd Place W
- 23917 104th Ave W
- 23914 102nd Ave W