NOT LISTED FOR SALE

Estimated Value: $395,000 - $454,000

3 Beds
3 Baths
2,058 Sq Ft
$208/Sq Ft Est. Value

Last Sold November 14, 2022

Last sale price $350,000 $170 Per Sq Ft

Est. 23% increase in value since last sale

Current estimated payment $2,619/month

About This Home

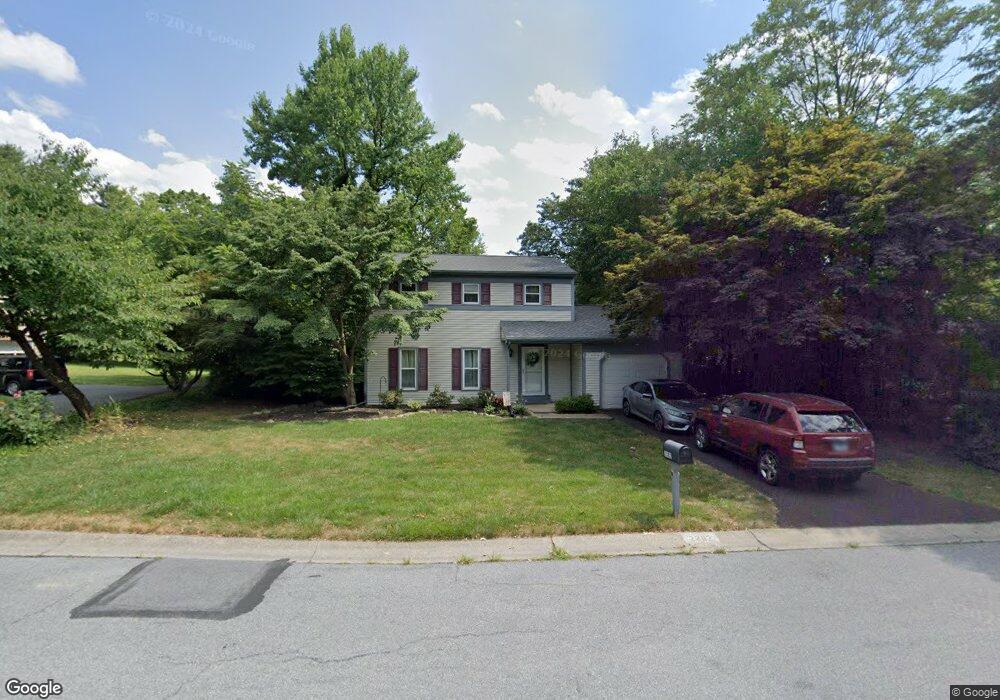
Welcome to 2382 Hancock Drive! This beautiful 3 bedroom, 2.5 bath home features brand new hickory luxury vinyl flooring in the living room and dining room. The light and bright kitchen opens to a family room with a cozy wood burning fireplace. Screened in porch off the family room, offers a great outdoor living space to entertain or enjoy a morning cup of coffee. Second floor features owners suite and new flooring throughout. Finished basement with bar adds some great additional living space to the home. Home also has a brand new roof and has been freshly landscaped. Private lot with large flat backyard that's completely fenced in! Great Manheim Township location, quiet street just minutes from restaurants, shopping, Overlook campus, etc. You don't want to miss this home!

Ownership History

Date Name Owned For Owner Type

Purchase Details

Listed on
Sep 27, 2022
Closed on
Nov 14, 2022
Sold by
Fish Michael J
Bought by
Waters James L and Waters Elyse L
Seller's Agent
Abby Young
Coldwell Banker Realty
Buyer's Agent
Tyler Stoltz
Berkshire Hathaway HomeServices Homesale Realty
List Price
$345,000
Sold Price
$350,000
Premium/Discount to List
$5,000
1.45%
Views
18
Current Estimated Value
$428,912

Home Financials for this Owner

Home Financials are based on the most recent Mortgage that was taken out on this home.
Estimated Appreciation
$78,912
Avg. Annual Appreciation
7.14%
Original Mortgage
$332,500
Outstanding Balance
$322,133
Interest Rate
6.92%
Mortgage Type
New Conventional
Estimated Equity
$106,779

Purchase Details

Closed on
Nov 16, 2017
Sold by
Fish Michael J and Fish Elizabeth T
Bought by
Fish Michael J

Purchase Details

Listed on
May 12, 2015
Closed on
Sep 30, 2015
Sold by
Cherry Robert J and Cherry Kim L
Bought by
Fish Michael J and Fish Elizabeth T
Seller's Agent
Jack Depew
Realty ONE Group Unlimited
Buyer's Agent
Debra Apple
Berkshire Hathaway HomeServices Homesale Realty
List Price
$214,900
Sold Price
$213,400
Premium/Discount to List
-$1,500
-0.7%

Home Financials for this Owner

Home Financials are based on the most recent Mortgage that was taken out on this home.
Avg. Annual Appreciation
7.17%
Original Mortgage
$217,988
Interest Rate
3.95%
Mortgage Type
VA

Purchase Details

Closed on
May 24, 2006
Sold by
Chastain Patricia E
Bought by
Rains Thomas D and Rains Marcella D

Purchase Details

Closed on
Aug 4, 2005
Sold by
Park Wendy K
Bought by
Chastain Patricia E

Home Financials for this Owner

Home Financials are based on the most recent Mortgage that was taken out on this home.
Original Mortgage
$144,900
Interest Rate
5.63%
Mortgage Type
Fannie Mae Freddie Mac
Source: Public Records

Range of Values:

Collateral Analytics

Collateral Analytics Collateral Analytics AVMs (Automated Valuation Model) employ a number of statistical approaches combined with neighborhood-specific comparable selection guarantees the most up-to-date and precise valuations.

Not Available

Collateral Analytics does not have data for the current month. Please view the chart for historical values.

ICE

ICE Mortgage Technology ICE Mortgage Technology’s AVM (Automated Valuation Model) is a state-of-the-art online residential property valuation tool that provides a quick and accurate estimate of the value of almost any home in the U.S.

Not Available

ICE Mortgage Technology does not have data for the current month. Please view the chart for historical values.

First American

First American First American Data & Analytics’ next-generation AVM combines unrivaled data assets with a blended ensemble of valuation models to produce highly accurate, reliable valuations you can trust.

Not Available

First American does not have data for the current month. Please view the chart for historical values.

Quantarium

Quantarium Quantarium’s valuation service, repeatedly proven the industry’s most accurate and comprehensive, is supercharged with a self-learning and auto-tuning AI engine that continually becomes smarter and more accurate as it processes daily inputs from the industry’s leading RE data lake.

Not Available

Quantarium does not have data for the current month. Please view the chart for historical values.

Average Value
Not Available
List Price
Sold Price
Create a Home Valuation Report for This Property
The Home Valuation Report is an in-depth analysis detailing your home's value as well as a comparison with similar homes in the area

Home Values in the Area

Source: Public Records

Average Home Value in this Area


Source: Public Records

Purchase History

Date Buyer Sale Price Title Company
Waters James L $350,000 --
Fish Michael J -- None Available
Fish Michael J $213,400 None Available
Rains Thomas D $210,000 None Available
Chastain Patricia E $189,900 --
Source: Public Records

Mortgage History

Date Status Borrower Loan Amount
Open Waters James L $332,500
Previous Owner Fish Michael J $217,988
Previous Owner Chastain Patricia E $144,900
Source: Public Records

Property History

Date Event Price List to Sale Price per Sq Ft Prior Sale
11/14/2022 11/14/22 Sold $350,000 +1.4% $170 / Sq Ft View Prior Sale
09/30/2022 09/30/22 Pending -- -- --
09/27/2022 09/27/22 For Sale $345,000 +61.7% $168 / Sq Ft
09/30/2015 09/30/15 Sold $213,400 -0.7% $104 / Sq Ft View Prior Sale
07/15/2015 07/15/15 Pending -- -- --
05/12/2015 05/12/15 For Sale $214,900 -- $104 / Sq Ft

Tax History Compared to Growth

Source: Public Records

Tax History

Year Tax Paid Tax Assessment Tax Assessment Total Assessment is a certain percentage of the fair market value that is determined by local assessors to be the total taxable value of land and additions on the property. Land Improvement
2025 $4,492 $207,600 $71,100 $136,500
2024 $4,492 $207,600 $71,100 $136,500
2023 $4,375 $207,600 $71,100 $136,500
2022 $4,301 $207,600 $71,100 $136,500
2021 $4,205 $207,600 $71,100 $136,500
2020 $4,205 $207,600 $71,100 $136,500
2019 $4,164 $207,600 $71,100 $136,500
2018 $5,057 $207,600 $71,100 $136,500
2017 $3,957 $155,500 $45,000 $110,500
2016 $3,957 $155,500 $45,000 $110,500
2015 $994 $155,500 $45,000 $110,500
2014 $2,791 $155,500 $45,000 $110,500
Source: Public Records

Agents Affiliated with this Home

  • Section Image
  • Section Image
  • Section Image
See All Agents

Map