Estimated Value: $153,377 - $214,000
3
Beds
1
Bath
1,116
Sq Ft
$157/Sq Ft
Est. Value
About This Home
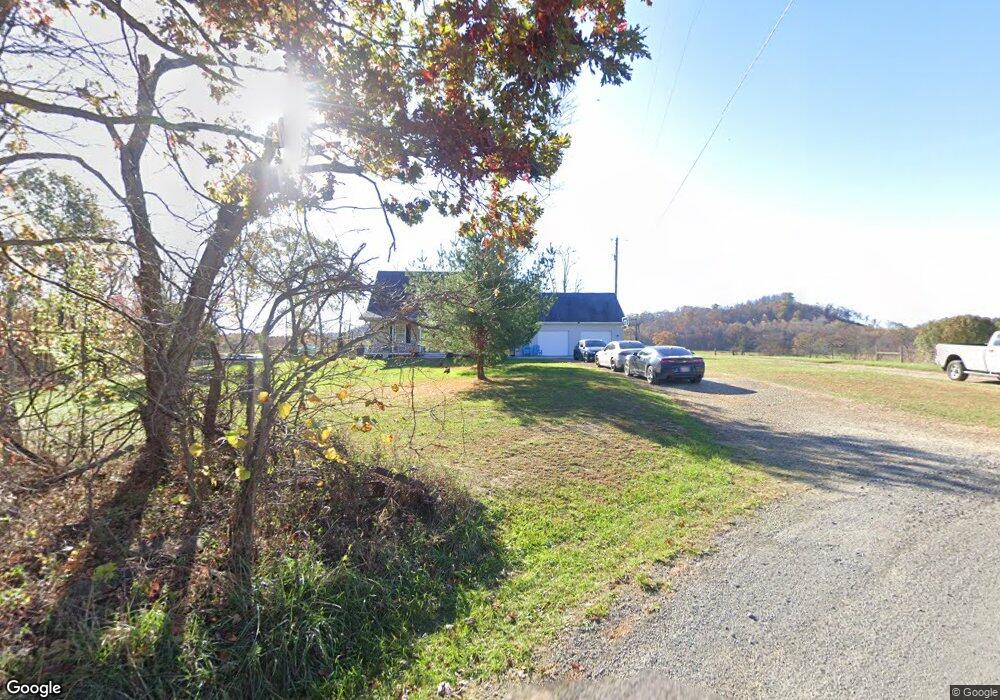
This home is located at 2382 Mercer Cox Rd, Otway, OH 45657 and is currently estimated at $175,094, approximately $156 per square foot. 2382 Mercer Cox Rd is a home located in Scioto County with nearby schools including Northwest Elementary School, Northwest Middle School, and Northwest High School.
Ownership History
Date
Name
Owned For
Owner Type
Purchase Details
Closed on
Apr 19, 2024
Sold by
Howard Ramona J and Howard Robert C
Bought by
Logan Dewayne
Current Estimated Value
Home Financials for this Owner
Home Financials are based on the most recent Mortgage that was taken out on this home.
Original Mortgage
$61,494
Outstanding Balance
$59,947
Interest Rate
4%
Mortgage Type
VA
Estimated Equity
$115,147
Purchase Details
Closed on
Mar 17, 2017
Sold by
Enz Ernest C
Bought by
Howard Ramona J
Purchase Details
Closed on
Apr 5, 2014
Sold by
Robert C Robert C and Enz-Howard Ramona J
Bought by
Enz Ernest C
Purchase Details
Closed on
Jan 18, 2008
Sold by
Carl Carl and Sexton Tamela
Bought by
Howard Robert C and Enz-Howard Ramona J
Purchase Details
Closed on
Mar 17, 2007
Sold by
Altenburg Patricia A and Altenburg
Bought by
Sexton Carl and Sexton Tamela
Purchase Details
Closed on
Jan 1, 1987
Bought by
Altenburg Patricia Ann
Create a Home Valuation Report for This Property
The Home Valuation Report is an in-depth analysis detailing your home's value as well as a comparison with similar homes in the area
Home Values in the Area
Average Home Value in this Area
Purchase History
| Date | Buyer | Sale Price | Title Company |
|---|---|---|---|
| Logan Dewayne | $61,500 | Bestitle Agency | |
| Howard Ramona J | -- | -- | |
| Enz Ernest C | -- | -- | |
| Howard Robert C | -- | -- | |
| Sexton Carl | -- | -- | |
| Altenburg Patricia Ann | -- | -- |
Source: Public Records
Mortgage History
| Date | Status | Borrower | Loan Amount |
|---|---|---|---|
| Open | Logan Dewayne | $61,494 |
Source: Public Records
Tax History Compared to Growth
Tax History
| Year | Tax Paid | Tax Assessment Tax Assessment Total Assessment is a certain percentage of the fair market value that is determined by local assessors to be the total taxable value of land and additions on the property. | Land | Improvement |
|---|---|---|---|---|
| 2024 | $1,965 | $46,130 | $4,970 | $41,160 |
| 2023 | $1,965 | $46,130 | $4,970 | $41,160 |
| 2022 | $1,766 | $46,130 | $4,970 | $41,160 |
| 2021 | $1,393 | $38,140 | $4,380 | $33,760 |
| 2020 | $1,393 | $38,140 | $4,380 | $33,760 |
| 2019 | $1,391 | $36,740 | $3,970 | $32,770 |
| 2018 | $1,357 | $36,740 | $3,970 | $32,770 |
| 2017 | $1,357 | $36,740 | $3,970 | $32,770 |
| 2016 | $1,352 | $35,970 | $3,480 | $32,490 |
| 2015 | $1,323 | $35,970 | $3,480 | $32,490 |
| 2013 | $1,174 | $33,440 | $3,480 | $29,960 |
Source: Public Records
Map
Nearby Homes
- 0 Bear Creek Rarden Rd
- 3111 Big Bear Creek Rd
- 3111 Bear Creek Rarden Rd
- 997 Big Bear Creek Rd
- 948 Big Bear Creek Rd
- 235 Mercer-Cox Rd
- 1371 Coldicott Hill Rd
- 12705
- 1459 Kizzie Run Rd
- van Crabtree Cemetery Road Lot Unit Wp001
- 0 Bear Creek Rarden Rd
- 284 Camp Creek Rd
- Bear Creek Rarden Rd
- 2350 Hiles Rd
- 2840 Henley Comstock Rd
- 220 Current Rd Unit T333
- 525 Martin Cemetery Rd
- 230 Newman Aly
- Acres Henley-Comstock Rd
- Ohio 348
- 2376 Mercer Cox Rd
- 2376 Mercer-Cox Rd
- 2319 Mercer Cox Rd
- 2516 Mercer Cox Rd
- 2545 Mercer Cox Rd
- 2503 Bear Creek Rarden Rd
- 2535 Bear Creek Rarden Rd
- 2535 Big Bear Creek Rd
- 2760 Bear Creek Rarden Rd
- 3734 Bear Creek Rarden Rd
- 2651 Bear Creek Rarden Rd
- 87 Roney Rd
- 4197 Mount Hope Rd
- 4197 Mt Hope Rd
- 2191 Bear Creek Rarden Rd
- 315 Roney Rd
- 2044 Bear Creek Rarden Rd
- 2107 Bear Creek Rarden Rd
- 4515 Mount Hope Rd
- 2759 Bear Creek Rarden Rd