2382 Roth Dr Cuyahoga Falls, OH 44221
Phelps Avenue NeighborhoodEstimated Value: $173,000 - $208,000
3
Beds
1
Bath
816
Sq Ft
$233/Sq Ft
Est. Value
About This Home
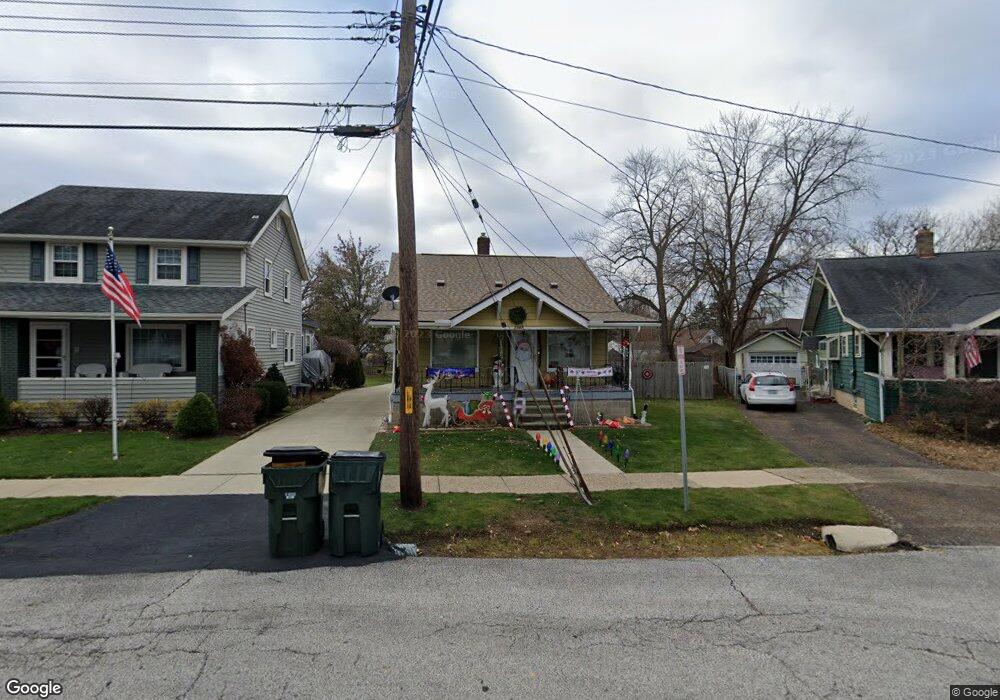
This home is located at 2382 Roth Dr, Cuyahoga Falls, OH 44221 and is currently estimated at $190,175, approximately $233 per square foot. 2382 Roth Dr is a home located in Summit County with nearby schools including Dewitt Elementary School, Bolich Middle School, and Cuyahoga Falls High School.
Ownership History
Date
Name
Owned For
Owner Type
Purchase Details
Closed on
Jul 10, 2010
Sold by
Baker David L
Bought by
Baker Robert E
Current Estimated Value
Home Financials for this Owner
Home Financials are based on the most recent Mortgage that was taken out on this home.
Original Mortgage
$74,003
Outstanding Balance
$48,308
Interest Rate
4.37%
Mortgage Type
FHA
Estimated Equity
$141,867
Purchase Details
Closed on
Feb 11, 1999
Sold by
Estate Of Maxine A Baker
Bought by
Baker Robert E
Create a Home Valuation Report for This Property
The Home Valuation Report is an in-depth analysis detailing your home's value as well as a comparison with similar homes in the area
Home Values in the Area
Average Home Value in this Area
Purchase History
| Date | Buyer | Sale Price | Title Company |
|---|---|---|---|
| Baker Robert E | $75,000 | Monarch Title Services Of Oh | |
| Baker Robert E | -- | -- |
Source: Public Records
Mortgage History
| Date | Status | Borrower | Loan Amount |
|---|---|---|---|
| Open | Baker Robert E | $74,003 |
Source: Public Records
Tax History Compared to Growth
Tax History
| Year | Tax Paid | Tax Assessment Tax Assessment Total Assessment is a certain percentage of the fair market value that is determined by local assessors to be the total taxable value of land and additions on the property. | Land | Improvement |
|---|---|---|---|---|
| 2025 | $3,140 | $58,149 | $13,713 | $44,436 |
| 2024 | $3,140 | $58,149 | $13,713 | $44,436 |
| 2023 | $3,140 | $58,149 | $13,713 | $44,436 |
| 2022 | $2,770 | $41,664 | $9,590 | $32,074 |
| 2021 | $2,770 | $41,664 | $9,590 | $32,074 |
| 2020 | $2,725 | $41,660 | $9,590 | $32,070 |
| 2019 | $2,491 | $34,700 | $9,460 | $25,240 |
| 2018 | $2,115 | $34,700 | $9,460 | $25,240 |
| 2017 | $2,087 | $34,700 | $9,460 | $25,240 |
| 2016 | $2,088 | $34,700 | $9,460 | $25,240 |
| 2015 | $2,087 | $34,700 | $9,460 | $25,240 |
| 2014 | $2,088 | $34,700 | $9,460 | $25,240 |
| 2013 | $2,127 | $35,650 | $9,460 | $26,190 |
Source: Public Records
Map
Nearby Homes