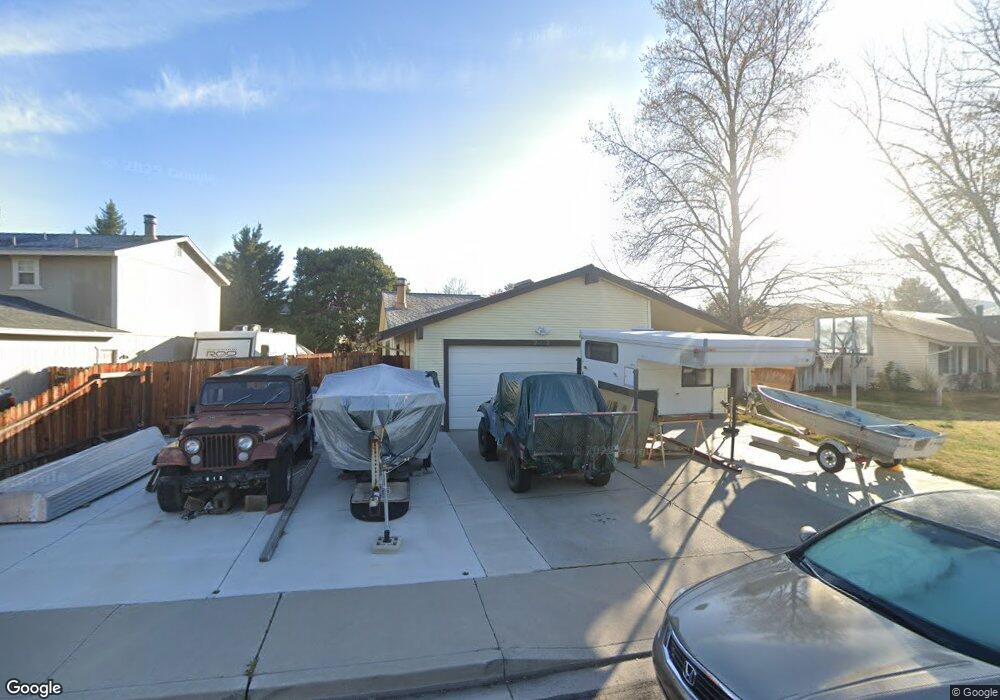
2382 William Morby Dr Sparks, NV 89434
O'Callaghan NeighborhoodEstimated Value: $457,649 - $529,000
4
Beds
2
Baths
1,786
Sq Ft
$274/Sq Ft
Est. Value
About This Home
This home is located at 2382 William Morby Dr, Sparks, NV 89434 and is currently estimated at $489,412, approximately $274 per square foot. 2382 William Morby Dr is a home located in Washoe County with nearby schools including Katherine Dunn Elementary School, George L Dilworth Middle School, and Edward C Reed High School.
Ownership History
Date
Name
Owned For
Owner Type
Purchase Details
Closed on
Apr 6, 2000
Sold by
Karlowicz Edward S and Karlowicz Anita M
Bought by
Smith Glenn E and Smith Nancy J
Current Estimated Value
Home Financials for this Owner
Home Financials are based on the most recent Mortgage that was taken out on this home.
Original Mortgage
$143,978
Interest Rate
8.08%
Mortgage Type
FHA
Purchase Details
Closed on
Sep 2, 1999
Sold by
Karlowicz Edward S
Bought by
Karlowicz Edward S and Karlowicz Anita M
Purchase Details
Closed on
Feb 23, 1998
Sold by
Karlowicz Edward S
Bought by
Karlowicz Edward S
Home Financials for this Owner
Home Financials are based on the most recent Mortgage that was taken out on this home.
Original Mortgage
$60,000
Interest Rate
6.9%
Purchase Details
Closed on
Oct 26, 1995
Sold by
Karlowicz Edward S
Bought by
Karlowicz Edward S
Create a Home Valuation Report for This Property
The Home Valuation Report is an in-depth analysis detailing your home's value as well as a comparison with similar homes in the area
Home Values in the Area
Average Home Value in this Area
Purchase History
| Date | Buyer | Sale Price | Title Company |
|---|---|---|---|
| Smith Glenn E | $147,000 | Stewart Title Northern Nevad | |
| Karlowicz Edward S | -- | -- | |
| Karlowicz Edward S | -- | First Centennial Title Co | |
| Karlowicz Edward S | -- | -- |
Source: Public Records
Mortgage History
| Date | Status | Borrower | Loan Amount |
|---|---|---|---|
| Previous Owner | Smith Glenn E | $143,978 | |
| Previous Owner | Karlowicz Edward S | $60,000 |
Source: Public Records
Tax History Compared to Growth
Tax History
| Year | Tax Paid | Tax Assessment Tax Assessment Total Assessment is a certain percentage of the fair market value that is determined by local assessors to be the total taxable value of land and additions on the property. | Land | Improvement |
|---|---|---|---|---|
| 2025 | $1,589 | $66,633 | $37,275 | $29,358 |
| 2024 | $1,589 | $61,616 | $32,620 | $28,996 |
| 2023 | $1,151 | $58,592 | $31,710 | $26,882 |
| 2022 | $1,500 | $50,546 | $27,475 | $23,071 |
| 2021 | $1,457 | $44,896 | $21,175 | $23,721 |
| 2020 | $1,413 | $44,983 | $20,510 | $24,473 |
| 2019 | $1,372 | $43,182 | $18,865 | $24,317 |
| 2018 | $1,333 | $37,831 | $13,405 | $24,426 |
| 2017 | $1,294 | $37,873 | $12,810 | $25,063 |
| 2016 | $1,261 | $38,395 | $12,355 | $26,040 |
| 2015 | $1,259 | $36,271 | $9,695 | $26,576 |
| 2014 | $1,222 | $34,743 | $8,435 | $26,308 |
| 2013 | -- | $32,528 | $6,055 | $26,473 |
Source: Public Records
Map
Nearby Homes
- 1051 Glen Martin Dr
- 913 Glen Molly Dr
- 1973 Rio Tinto Dr
- 1095 E York Way
- 1897 Bonita Vista Dr
- 1970 Woodhaven Ln
- 745 Glen Vista Dr
- 1128 Bradley Square
- 1990 Fargo Way
- 1029 Baywood Dr Unit D
- 1728 Bluehaven Dr
- 1544 Woodhaven Ln
- 2407 Sunny Slope Dr Unit 1
- 2435 Sycamore Glen Dr Unit 2
- 1035 Baywood Dr Unit D
- 3167 Bristle Branch Dr
- 3188 Bristle Branch Dr
- 3198 Bristle Branch Dr
- 3200 Bristle Branch Dr
- 2252 Sycamore Glen Dr
- 2392 William Morby Dr
- 2362 William Morby Dr
- 1035 Monson Dr
- 1015 Monson Dr
- 1065 Monson Dr
- 2383 William Morby Dr
- 2356 William Morby Dr
- 2373 William Morby Dr
- 2384 Howard Dr
- 2363 William Morby Dr
- 1075 Monson Dr
- 2357 William Morby Dr
- 2372 Howard Dr
- 2352 William Morby Dr
- 2415 Howard Dr
- 2435 Howard Dr
- 2495 Howard Dr
- 1010 Jason Dr
- 2475 Howard Dr
- 1095 Monson Dr