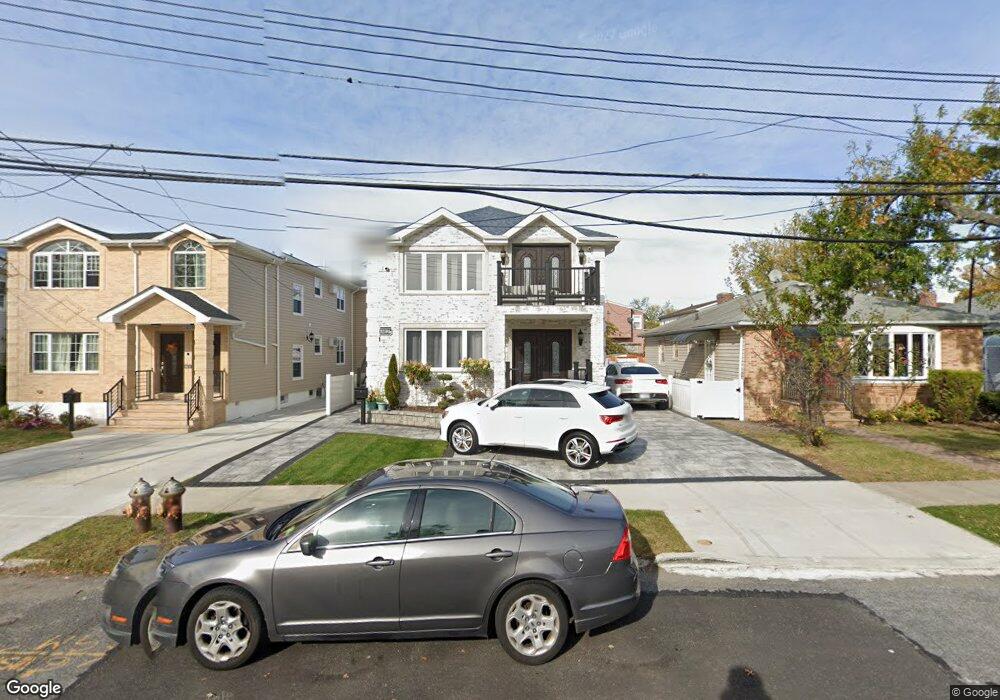
23823 149th Ave Rosedale, NY 11422
Rosedale NeighborhoodEstimated Value: $810,000 - $1,421,579
--
Bed
--
Bath
2,394
Sq Ft
$498/Sq Ft
Est. Value
About This Home
This home is located at 23823 149th Ave, Rosedale, NY 11422 and is currently estimated at $1,192,145, approximately $497 per square foot. 23823 149th Ave is a home located in Queens County with nearby schools including P.S. 181 Brookfield, Collaborative Arts Middle School, and Success Academy Charter School - Rosedale.
Ownership History
Date
Name
Owned For
Owner Type
Purchase Details
Closed on
Nov 14, 2024
Sold by
Moran Madeena and Persaud Rajkumar
Bought by
Sanchez Acosta Jose E
Current Estimated Value
Home Financials for this Owner
Home Financials are based on the most recent Mortgage that was taken out on this home.
Original Mortgage
$687,500
Outstanding Balance
$680,395
Interest Rate
6.44%
Mortgage Type
Purchase Money Mortgage
Estimated Equity
$511,750
Purchase Details
Closed on
Apr 14, 2021
Sold by
Persaud Pauline and Persaud Rajkumar
Bought by
Moran Madeena and Persaud Rajkumar
Purchase Details
Closed on
Mar 28, 2018
Sold by
April Kinloch As Trustee and Arpil Womack As Trustee
Bought by
Persaud Pauline and Persaud Rajkumar
Purchase Details
Closed on
Aug 19, 2014
Sold by
Womack Ronald
Bought by
Ronald Womack Irrevocable Trust and Womack
Purchase Details
Closed on
Aug 14, 2013
Sold by
Womack Ronald and Womack Sondra
Bought by
Womack Ronald
Create a Home Valuation Report for This Property
The Home Valuation Report is an in-depth analysis detailing your home's value as well as a comparison with similar homes in the area
Home Values in the Area
Average Home Value in this Area
Purchase History
| Date | Buyer | Sale Price | Title Company |
|---|---|---|---|
| Sanchez Acosta Jose E | $1,375,000 | -- | |
| Moran Madeena | -- | -- | |
| Moran Madeena | -- | -- | |
| Persaud Pauline | $425,000 | -- | |
| Persaud Pauline | $425,000 | -- | |
| Ronald Womack Irrevocable Trust | -- | -- | |
| Ronald Womack Irrevocable Trust | -- | -- | |
| Womack Ronald | -- | -- | |
| Womack Ronald | -- | -- |
Source: Public Records
Mortgage History
| Date | Status | Borrower | Loan Amount |
|---|---|---|---|
| Open | Sanchez Acosta Jose E | $687,500 |
Source: Public Records
Tax History Compared to Growth
Tax History
| Year | Tax Paid | Tax Assessment Tax Assessment Total Assessment is a certain percentage of the fair market value that is determined by local assessors to be the total taxable value of land and additions on the property. | Land | Improvement |
|---|---|---|---|---|
| 2025 | $10,738 | $53,462 | $7,442 | $46,020 |
| 2024 | $10,738 | $53,462 | $8,919 | $44,543 |
| 2023 | $10,700 | $53,273 | $8,390 | $44,883 |
| 2022 | $10,325 | $51,720 | $9,780 | $41,940 |
| 2021 | $9,995 | $48,900 | $9,780 | $39,120 |
| 2020 | $4,139 | $29,820 | $9,780 | $20,040 |
| 2019 | $4,090 | $25,560 | $9,780 | $15,780 |
| 2018 | $3,941 | $20,794 | $6,806 | $13,988 |
| 2017 | $3,699 | $19,617 | $8,241 | $11,376 |
| 2016 | $3,390 | $19,617 | $8,241 | $11,376 |
| 2015 | $2,517 | $17,460 | $8,160 | $9,300 |
| 2014 | $2,517 | $17,460 | $8,160 | $9,300 |
Source: Public Records
Map
Nearby Homes
- 238-47 148th Dr
- 238-11 148th Dr
- 240-24 149th Ave
- 24112 148th Ave
- 241-12 148th Ave
- 241-23 148th Ave
- 241-49 148th Dr
- 23514 147th Dr
- 23915 147th Rd
- 26 240th St
- 147-11 232nd St
- 24519 147th Dr
- 245-39 147th Dr
- 24533 147th Rd
- 147-50 231st St
- 14848 231st St
- 14632 Huxley St
- 245-47 148th Dr
- 23027 148th Ave
- 146-15 243rd St
- 238-23 149th Ave
- 23827 149th Ave
- 238-19 149th Ave
- 23819 149th Ave
- 238-39 149 Ave
- 23831 149th Ave
- 23815 149th Ave
- 23824 148th Dr
- 23828 148th Dr
- 23820 148th Dr
- 23835 149th Ave
- 23835 149th Ave
- 23832 148th Dr
- 238-32 148th Dr
- 238-32 148th Dr Unit 2
- 23811 149th Ave
- 23816 148th Dr
- 23816 148th Dr
- 23816 148th Dr
- 23836 148th Dr Unit Second floor