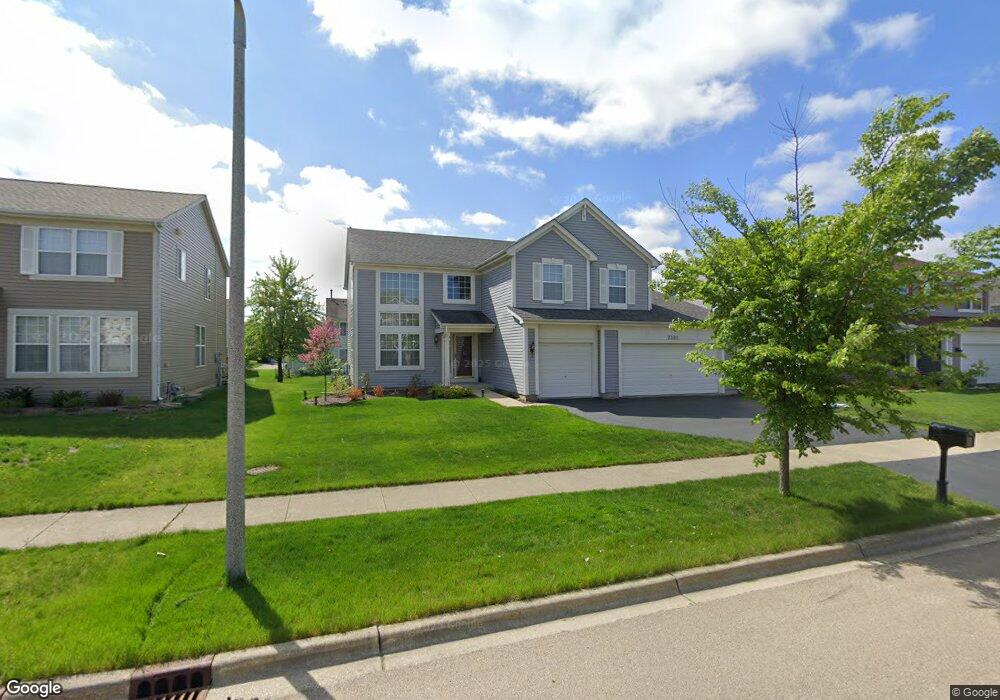
2383 Forsyth Ln Unit 4 Aurora, IL 60502
Big Woods Marmion NeighborhoodEstimated Value: $517,000 - $618,000
3
Beds
3
Baths
2,711
Sq Ft
$207/Sq Ft
Est. Value
About This Home
This home is located at 2383 Forsyth Ln Unit 4, Aurora, IL 60502 and is currently estimated at $561,135, approximately $206 per square foot. 2383 Forsyth Ln Unit 4 is a home located in DuPage County with nearby schools including Gwendolyn Brooks Elementary School, Francis Granger Middle School, and Metea Valley High School.
Ownership History
Date
Name
Owned For
Owner Type
Purchase Details
Closed on
Feb 14, 2003
Sold by
Siluveru Omprakash and Siluveru Jyothirmai
Bought by
Siluveru Omprakash and Maakam Jyothirmai
Current Estimated Value
Home Financials for this Owner
Home Financials are based on the most recent Mortgage that was taken out on this home.
Original Mortgage
$232,200
Interest Rate
6%
Purchase Details
Closed on
Mar 9, 2001
Sold by
Drh Cambridge Homes Inc
Bought by
Siluveru Omprakash and Siluveru Jyothirmai
Home Financials for this Owner
Home Financials are based on the most recent Mortgage that was taken out on this home.
Original Mortgage
$260,000
Interest Rate
7.02%
Create a Home Valuation Report for This Property
The Home Valuation Report is an in-depth analysis detailing your home's value as well as a comparison with similar homes in the area
Home Values in the Area
Average Home Value in this Area
Purchase History
| Date | Buyer | Sale Price | Title Company |
|---|---|---|---|
| Siluveru Omprakash | -- | Lawyers Title | |
| Siluveru Omprakash | $277,000 | First American Title Ins |
Source: Public Records
Mortgage History
| Date | Status | Borrower | Loan Amount |
|---|---|---|---|
| Closed | Siluveru Omprakash | $232,200 | |
| Closed | Siluveru Omprakash | $260,000 |
Source: Public Records
Tax History Compared to Growth
Tax History
| Year | Tax Paid | Tax Assessment Tax Assessment Total Assessment is a certain percentage of the fair market value that is determined by local assessors to be the total taxable value of land and additions on the property. | Land | Improvement |
|---|---|---|---|---|
| 2024 | $11,184 | $155,094 | $32,341 | $122,753 |
| 2023 | $10,676 | $139,360 | $29,060 | $110,300 |
| 2022 | $11,038 | $137,630 | $28,460 | $109,170 |
| 2021 | $10,749 | $132,710 | $27,440 | $105,270 |
| 2020 | $10,880 | $132,710 | $27,440 | $105,270 |
| 2019 | $10,502 | $126,220 | $26,100 | $100,120 |
| 2018 | $10,207 | $121,560 | $25,500 | $96,060 |
| 2017 | $10,040 | $117,430 | $24,630 | $92,800 |
| 2016 | $9,866 | $112,700 | $23,640 | $89,060 |
| 2015 | $9,771 | $107,010 | $22,450 | $84,560 |
| 2014 | $9,062 | $96,950 | $20,180 | $76,770 |
| 2013 | $8,968 | $97,620 | $20,320 | $77,300 |
Source: Public Records
Map
Nearby Homes
- 2634 Oakshire Ct
- 2315 Nan St
- 2979 Arbor Ln
- 2762 Shetland Ln
- 1942 Tall Oaks Dr Unit 1A
- 1953 Charles Ln Unit 1953
- 2428 Ridgewood Ct
- 3003 Abbey Cir
- 3075 Mesa Ln
- 3001 Abbey Cir
- 1826 N Farnsworth Ave
- 2025 Gillenwater St
- 3S201 S Raddant Rd
- 1648 Mcclure Rd Unit 814
- 1750 N Marywood Ave Unit 315
- 1425 Mcclure Rd Unit 10
- 4S359 Meadow Rd
- 4S365 Meadow Rd
- 1630 Kemper Dr
- 1176 Heathrow Ln
- 2389 Forsyth Ln
- 2377 Forsyth Ln
- 2398 White Barn Rd
- 2392 White Barn Rd Unit 4
- 2395 Forsyth Ln
- 2378 Forsyth Ln
- 2428 Wydown Ln Unit 4
- 2436 Wydown Ln Unit 4
- 2404 White Barn Rd Unit 4
- 2384 Forsyth Ln
- 2372 Forsyth Ln
- 2390 Forsyth Ln
- 2410 White Barn Rd Unit 4
- 2401 Forsyth Ln
- 2444 Wydown Ln Unit 4
- 2396 Forsyth Ln Unit 4
- 2402 Forsyth Ln
- 2416 White Barn Rd
- 2407 Forsyth Ln Unit 4
- 2366 Forsyth Ln Unit 4