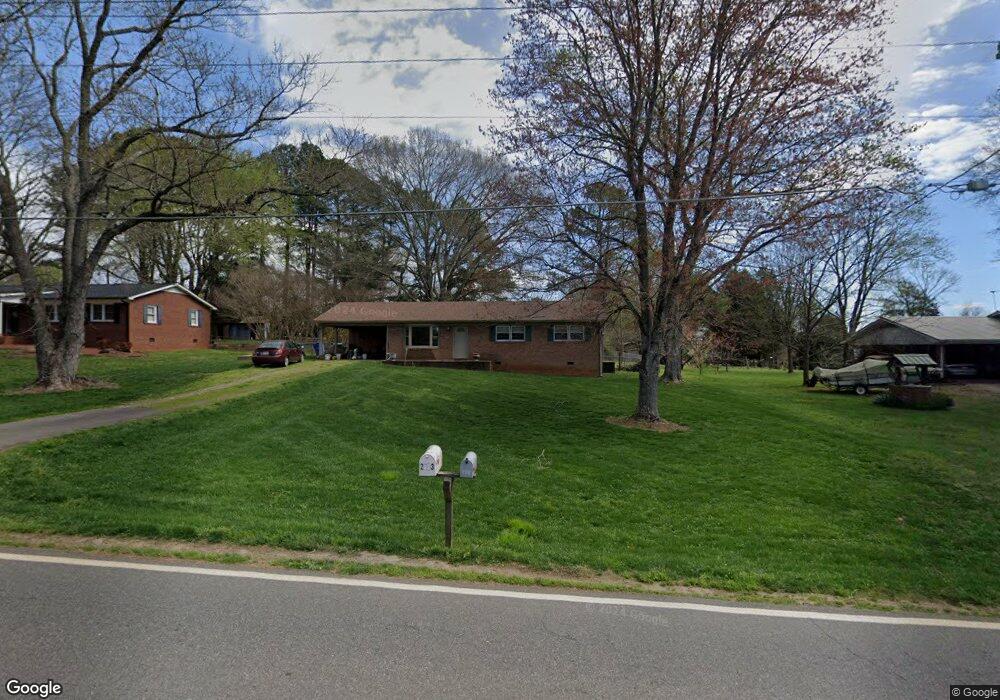
2383 S Chipley Ford Rd Statesville, NC 28625
Estimated Value: $195,000 - $217,171
3
Beds
2
Baths
1,380
Sq Ft
$152/Sq Ft
Est. Value
About This Home
This home is located at 2383 S Chipley Ford Rd, Statesville, NC 28625 and is currently estimated at $209,793, approximately $152 per square foot. 2383 S Chipley Ford Rd is a home located in Iredell County with nearby schools including Scotts Elementary School, West Iredell Middle School, and West Iredell High School.
Ownership History
Date
Name
Owned For
Owner Type
Purchase Details
Closed on
Oct 16, 2009
Sold by
Reese Mark A and Reese Kim P
Bought by
Kopp Jonathan D
Current Estimated Value
Home Financials for this Owner
Home Financials are based on the most recent Mortgage that was taken out on this home.
Original Mortgage
$86,000
Outstanding Balance
$55,203
Interest Rate
4.75%
Mortgage Type
New Conventional
Estimated Equity
$154,590
Purchase Details
Closed on
Dec 30, 1998
Sold by
Campbell Julian Scott and Campbell Nicole H
Bought by
Reese Mark A and Reese Kim P
Home Financials for this Owner
Home Financials are based on the most recent Mortgage that was taken out on this home.
Original Mortgage
$83,480
Interest Rate
6.12%
Mortgage Type
USDA
Purchase Details
Closed on
Oct 1, 1993
Purchase Details
Closed on
Aug 1, 1992
Purchase Details
Closed on
Jun 1, 1976
Create a Home Valuation Report for This Property
The Home Valuation Report is an in-depth analysis detailing your home's value as well as a comparison with similar homes in the area
Home Values in the Area
Average Home Value in this Area
Purchase History
| Date | Buyer | Sale Price | Title Company |
|---|---|---|---|
| Kopp Jonathan D | $85,000 | None Available | |
| Reese Mark A | $82,500 | -- | |
| -- | $59,500 | -- | |
| -- | -- | -- | |
| -- | $26,500 | -- |
Source: Public Records
Mortgage History
| Date | Status | Borrower | Loan Amount |
|---|---|---|---|
| Open | Kopp Jonathan D | $86,000 | |
| Previous Owner | Reese Mark A | $83,480 |
Source: Public Records
Tax History Compared to Growth
Tax History
| Year | Tax Paid | Tax Assessment Tax Assessment Total Assessment is a certain percentage of the fair market value that is determined by local assessors to be the total taxable value of land and additions on the property. | Land | Improvement |
|---|---|---|---|---|
| 2024 | $804 | $126,110 | $22,000 | $104,110 |
| 2023 | $804 | $126,110 | $22,000 | $104,110 |
| 2022 | $613 | $88,190 | $15,000 | $73,190 |
| 2021 | $609 | $88,190 | $15,000 | $73,190 |
| 2020 | $609 | $88,190 | $15,000 | $73,190 |
| 2019 | $601 | $88,190 | $15,000 | $73,190 |
| 2018 | $529 | $79,890 | $16,000 | $63,890 |
| 2017 | $529 | $79,890 | $16,000 | $63,890 |
| 2016 | $529 | $79,890 | $16,000 | $63,890 |
| 2015 | $529 | $79,890 | $16,000 | $63,890 |
| 2014 | $521 | $84,570 | $16,000 | $68,570 |
Source: Public Records
Map
Nearby Homes
- 121 Jenkins Rd
- 3643 S Chipley Ford Rd
- 148-151& 229-233 S Chipley Ford Rd
- 103 Roseman Ln
- 113 Rock Ave
- 117 Rock Ave
- 111 Rock Ave
- 108 Rock Ave
- 112 Rock Ave
- 119 Rock Ave
- 106 Rock Ave
- 118 Rock Ave
- 126 Rock Ave
- 125 Rock Ave
- 128 Backrush Ct
- 130 Rock Ave
- 204 Harriet Ln
- 149 Whitetail Rd
- 131 Clearview Rd
- 166 Rock Ave
- 2384 S Chipley Ford Rd
- 2388 S Chipley Ford Rd
- 2378 S Chipley Ford Rd
- 2394 S Chipley Ford Rd
- 117 Jenkins Rd
- 2381 S Chipley Ford Rd
- 2398 S Chipley Ford Rd
- 2395 S Chipley Ford Rd
- 355 Clearview Rd
- 2368 S Chipley Ford Rd
- 2404 S Chipley Ford Rd
- 320 Clearview Rd
- 115 Kalen Dr
- 115 Kalen Dr Unit 15 & pt14
- 2367 S Chipley Ford Rd
- 112 Jenkins Rd
- 118 Jenkins Rd
- 2408 S Chipley Ford Rd
- 124 Jenkins Rd
- 316 Clearview Rd