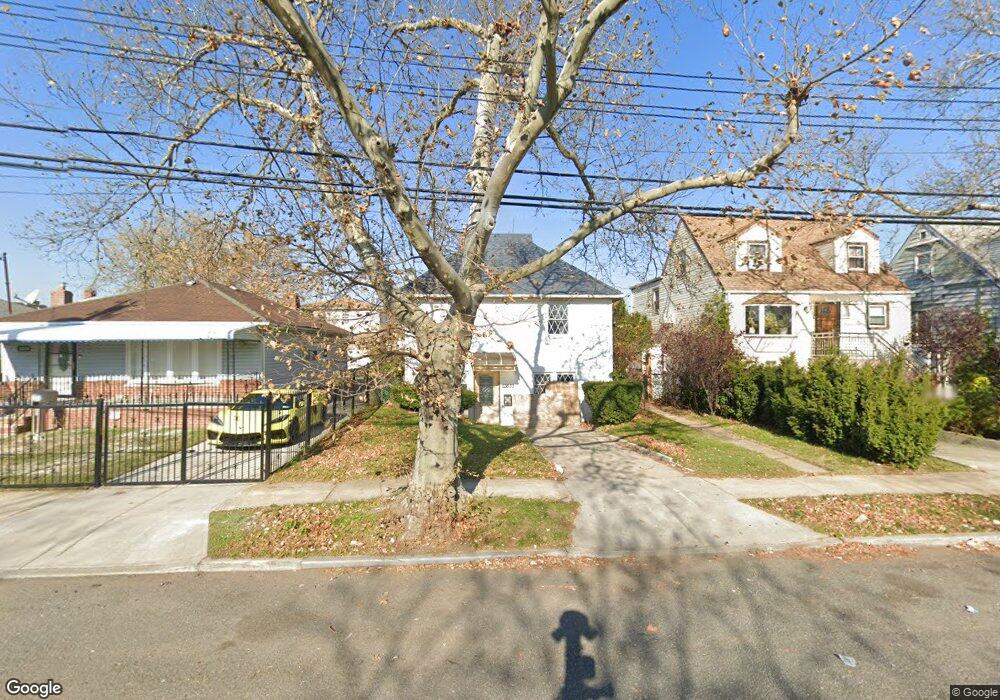
23839 149th Ave Rosedale, NY 11422
Rosedale NeighborhoodEstimated Value: $1,047,000 - $1,456,753
--
Bed
--
Bath
2,291
Sq Ft
$557/Sq Ft
Est. Value
About This Home
This home is located at 23839 149th Ave, Rosedale, NY 11422 and is currently estimated at $1,276,938, approximately $557 per square foot. 23839 149th Ave is a home located in Queens County with nearby schools including P.S. 181 Brookfield, Collaborative Arts Middle School, and Success Academy Charter School - Rosedale.
Ownership History
Date
Name
Owned For
Owner Type
Purchase Details
Closed on
Apr 22, 2025
Sold by
Sophia Anglin and Anglin Clifton A
Bought by
Anglin Sophia
Current Estimated Value
Purchase Details
Closed on
Jun 11, 2024
Sold by
Deluxe1properties Llc
Bought by
Anglin Clifton A and Anglin Sophia
Home Financials for this Owner
Home Financials are based on the most recent Mortgage that was taken out on this home.
Original Mortgage
$1,363,841
Interest Rate
7.22%
Mortgage Type
Purchase Money Mortgage
Purchase Details
Closed on
Aug 24, 2023
Sold by
Brooks Mandessa E and Foulkes Aereline
Bought by
Deluxe1properties Llc
Home Financials for this Owner
Home Financials are based on the most recent Mortgage that was taken out on this home.
Original Mortgage
$504,000
Interest Rate
6.81%
Mortgage Type
Purchase Money Mortgage
Purchase Details
Closed on
Aug 31, 2021
Sold by
Foulkes Aereline
Bought by
Brooks Mandessa Elizabeth and Foulkes Aereline
Create a Home Valuation Report for This Property
The Home Valuation Report is an in-depth analysis detailing your home's value as well as a comparison with similar homes in the area
Home Values in the Area
Average Home Value in this Area
Purchase History
| Date | Buyer | Sale Price | Title Company |
|---|---|---|---|
| Anglin Sophia | -- | Judicial Title | |
| Anglin Clifton A | $1,389,000 | -- | |
| Anglin Clifton A | $1,389,000 | -- | |
| Deluxe1properties Llc | $560,000 | -- | |
| Deluxe1properties Llc | $560,000 | -- | |
| Deluxe1properties Llc | $560,000 | -- | |
| Brooks Mandessa Elizabeth | -- | -- | |
| Brooks Mandessa Elizabeth | -- | -- |
Source: Public Records
Mortgage History
| Date | Status | Borrower | Loan Amount |
|---|---|---|---|
| Previous Owner | Anglin Clifton A | $1,363,841 | |
| Previous Owner | Deluxe1properties Llc | $504,000 |
Source: Public Records
Tax History
| Year | Tax Paid | Tax Assessment Tax Assessment Total Assessment is a certain percentage of the fair market value that is determined by local assessors to be the total taxable value of land and additions on the property. | Land | Improvement |
|---|---|---|---|---|
| 2025 | $6,334 | $37,370 | $6,813 | $30,557 |
| 2024 | $6,334 | $31,536 | $5,284 | $26,252 |
| 2023 | $6,005 | $31,298 | $5,010 | $26,288 |
| 2022 | $5,607 | $49,320 | $9,480 | $39,840 |
| 2021 | $5,567 | $43,080 | $9,480 | $33,600 |
| 2020 | $5,267 | $42,180 | $9,480 | $32,700 |
| 2019 | $5,205 | $36,120 | $9,480 | $26,640 |
| 2018 | $5,019 | $26,082 | $6,811 | $19,271 |
| 2017 | $4,716 | $24,606 | $7,950 | $16,656 |
| 2016 | $4,331 | $24,606 | $7,950 | $16,656 |
| 2015 | $3,160 | $21,900 | $7,920 | $13,980 |
| 2014 | $3,160 | $21,900 | $7,920 | $13,980 |
Source: Public Records
Map
Nearby Homes
- 238-47 148th Dr
- 240-24 149th Ave
- 238-11 148th Dr
- 24116 148th Rd
- 235-36 148th Ave
- 23515 Bentley Rd
- 23938 147th Dr
- 24149 148th Dr
- 241-49 148th Dr
- 241-23 148th Ave
- 23915 147th Rd
- 0 149th Ave Unit KEY967104
- 14772 Huxley St
- 241-07 147th Ave
- 245-11 149th Rd
- 245-47 148th Dr
- 14715 231st St
- 14848 231st St
- 14750 231st St
- 146-15 243rd St
- 238-39 149th Ave
- 23835 149th Ave
- 23843 149th Ave
- 23843 149th Ave
- 23835 149th Ave
- 23831 149th Ave
- 23847 149th Ave
- 23840 148th Dr
- 23844 148th Dr
- 23836 148th Dr Unit Second floor
- 23836 148th Dr
- 238-39 149 Ave
- 23851 149th Ave
- 23827 149th Ave
- 23848 148th Dr
- 238-63 149th Ave
- 238-48 148th Dr
- 238-52 148th Dr
- 238-32 148th Dr
- 238-32 148th Dr Unit 2
Your Personal Tour Guide
Ask me questions while you tour the home.