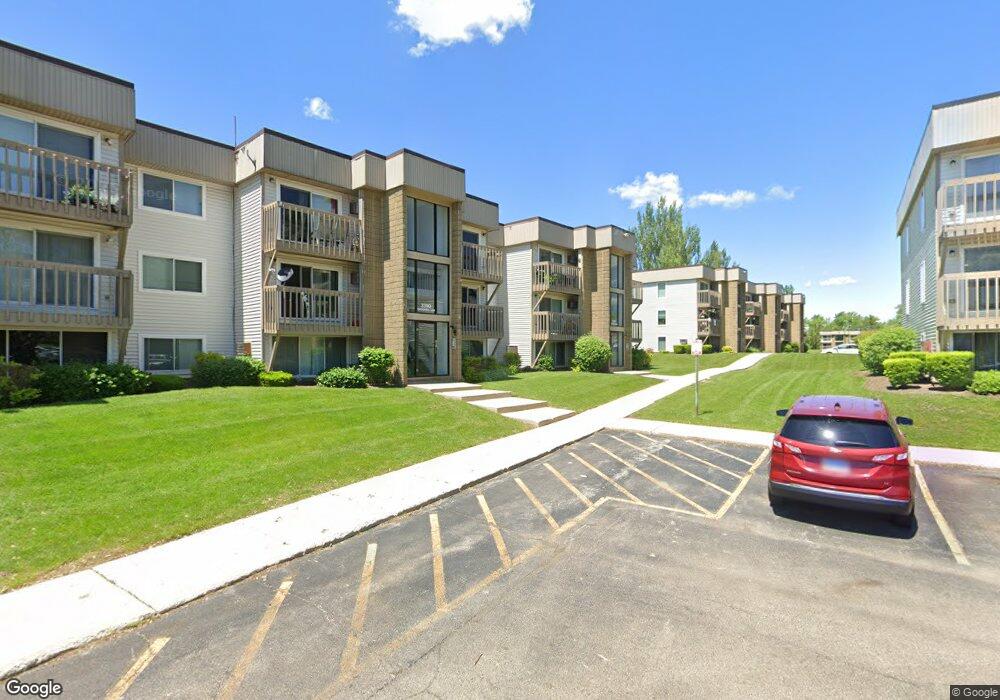
2384 Good Speed Ln Unit 2384A Schaumburg, IL 60194
West Schaumburg NeighborhoodEstimated Value: $130,000 - $148,399
2
Beds
--
Bath
850
Sq Ft
$164/Sq Ft
Est. Value
About This Home
This home is located at 2384 Good Speed Ln Unit 2384A, Schaumburg, IL 60194 and is currently estimated at $139,350, approximately $163 per square foot. 2384 Good Speed Ln Unit 2384A is a home located in Cook County with nearby schools including Elizabeth Blackwell Elementary School, Dwight D Eisenhower Junior High School, and Hoffman Estates High School.
Ownership History
Date
Name
Owned For
Owner Type
Purchase Details
Closed on
May 6, 2025
Sold by
Ruggirello Llc
Bought by
Sargon Boudakh Trust
Current Estimated Value
Purchase Details
Closed on
Apr 8, 2016
Sold by
S & B Investment Properties Llc
Bought by
Ruggirello Llc
Purchase Details
Closed on
Dec 14, 2005
Sold by
Globe Investments Real Estate Partnershi
Bought by
S & B Investment Properties Llc
Purchase Details
Closed on
Feb 4, 2000
Sold by
Suburban Bank Of Barrington
Bought by
Globe Investment Real Estate Partnership
Purchase Details
Closed on
Aug 25, 1994
Sold by
American National Bk & Tr Co Of Chicago
Bought by
Suburban Bank Of Barrington
Home Financials for this Owner
Home Financials are based on the most recent Mortgage that was taken out on this home.
Original Mortgage
$232,645
Interest Rate
8.44%
Create a Home Valuation Report for This Property
The Home Valuation Report is an in-depth analysis detailing your home's value as well as a comparison with similar homes in the area
Home Values in the Area
Average Home Value in this Area
Purchase History
| Date | Buyer | Sale Price | Title Company |
|---|---|---|---|
| Sargon Boudakh Trust | $135,000 | Chicago Title | |
| Ruggirello Llc | $525,000 | Precision Title | |
| S & B Investment Properties Llc | $520,000 | -- | |
| Globe Investment Real Estate Partnership | $360,000 | -- | |
| Suburban Bank Of Barrington | $260,000 | -- |
Source: Public Records
Mortgage History
| Date | Status | Borrower | Loan Amount |
|---|---|---|---|
| Previous Owner | Suburban Bank Of Barrington | $232,645 |
Source: Public Records
Tax History Compared to Growth
Tax History
| Year | Tax Paid | Tax Assessment Tax Assessment Total Assessment is a certain percentage of the fair market value that is determined by local assessors to be the total taxable value of land and additions on the property. | Land | Improvement |
|---|---|---|---|---|
| 2024 | $2,748 | $9,803 | $2,965 | $6,838 |
| 2023 | $2,665 | $9,803 | $2,965 | $6,838 |
| 2022 | $2,665 | $9,803 | $2,965 | $6,838 |
| 2021 | $2,418 | $7,923 | $2,028 | $5,895 |
| 2020 | $2,388 | $7,923 | $2,028 | $5,895 |
| 2019 | $2,404 | $8,850 | $2,028 | $6,822 |
| 2018 | $2,303 | $7,558 | $1,638 | $5,920 |
| 2017 | $2,260 | $7,558 | $1,638 | $5,920 |
| 2016 | $2,320 | $8,287 | $1,638 | $6,649 |
| 2015 | $1,620 | $5,339 | $1,482 | $3,857 |
| 2014 | $1,602 | $5,339 | $1,482 | $3,857 |
| 2013 | $1,562 | $5,339 | $1,482 | $3,857 |
Source: Public Records
Map
Nearby Homes
- 2342 Hamilton Place
- 2216 Andover Ct
- 8 Warwick Ct
- 1916 Quaker Hollow Ln Unit 14
- 1924 Quaker Hollow Ln Unit 14
- 1968 Quaker Hollow Ln Unit 12
- 741 N Walnut Ln
- 569 N Walnut Ln
- 208 Judy Ln
- 508 N Walnut Ln
- 808 Bishop Ct Unit 2
- 1912 Finchley Ct Unit 3
- 1929 Hastings Ct Unit 3
- 413 Linsey Ave
- 454 Willington Dr
- 198 Camden Ct Unit Z2
- 368 Glen Byrn Ct Unit 11368A
- 133 White Branch Ct S Unit 539
- 2741 Odlum Dr Unit 3
- 604 N Brookdale Dr
- 2384 Good Speed Ln Unit 2384F
- 2384 Good Speed Ln Unit 2384E
- 2384 Good Speed Ln Unit 2384D
- 2384 Good Speed Ln Unit 2384C
- 2384 Good Speed Ln Unit 2384B
- 2390 Good Speed Ln Unit 2390F
- 2390 Good Speed Ln Unit 2390E
- 2390 Good Speed Ln Unit 2390D
- 2390 Good Speed Ln Unit 2390C
- 2390 Good Speed Ln Unit 2390B
- 2390 Good Speed Ln Unit 2390A
- 2396 Good Speed Ln Unit 2396F
- 2396 Good Speed Ln Unit 2396E
- 2396 Good Speed Ln Unit 2396D
- 2396 Good Speed Ln Unit 2396C
- 2396 Good Speed Ln Unit 2396B
- 2396 Good Speed Ln Unit 2396A
- 2385 John Smith Dr Unit 2385A
- 2391 John Smith Dr Unit 2391F
- 2391 John Smith Dr Unit 2391D