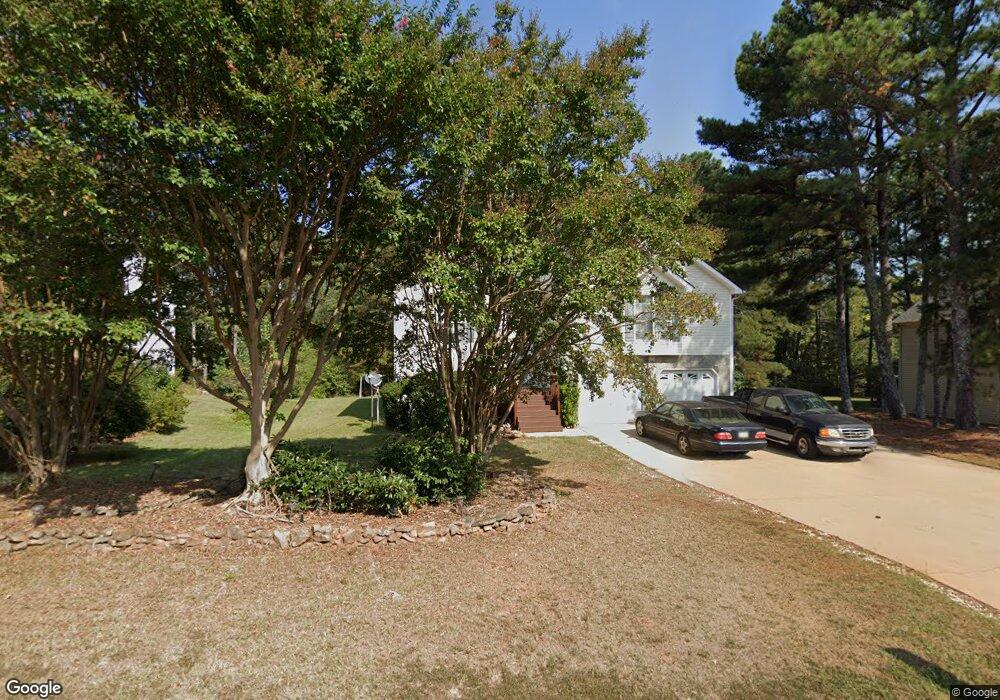
2384 Old Lower River Rd Unit 1 Douglasville, GA 30135
Lithia Springs NeighborhoodEstimated Value: $312,000 - $373,000
3
Beds
2
Baths
1,648
Sq Ft
$199/Sq Ft
Est. Value
About This Home
This home is located at 2384 Old Lower River Rd Unit 1, Douglasville, GA 30135 and is currently estimated at $328,736, approximately $199 per square foot. 2384 Old Lower River Rd Unit 1 is a home located in Douglas County with nearby schools including New Manchester Elementary School, Factory Shoals Middle School, and New Manchester High School.
Ownership History
Date
Name
Owned For
Owner Type
Purchase Details
Closed on
Mar 11, 2024
Sold by
Orr Gene A
Bought by
Orr Gene A and Orr Lesmer M
Current Estimated Value
Purchase Details
Closed on
Jun 22, 2001
Sold by
Jackson Darrell
Bought by
Orr Lesmer
Home Financials for this Owner
Home Financials are based on the most recent Mortgage that was taken out on this home.
Original Mortgage
$103,200
Interest Rate
6.97%
Mortgage Type
New Conventional
Purchase Details
Closed on
Dec 30, 1997
Sold by
Tuggle Homes
Bought by
Jackson Darrell
Home Financials for this Owner
Home Financials are based on the most recent Mortgage that was taken out on this home.
Original Mortgage
$99,920
Interest Rate
10.5%
Mortgage Type
New Conventional
Create a Home Valuation Report for This Property
The Home Valuation Report is an in-depth analysis detailing your home's value as well as a comparison with similar homes in the area
Home Values in the Area
Average Home Value in this Area
Purchase History
| Date | Buyer | Sale Price | Title Company |
|---|---|---|---|
| Orr Gene A | -- | None Listed On Document | |
| Orr Lesmer | $129,000 | -- | |
| Jackson Darrell | $124,900 | -- |
Source: Public Records
Mortgage History
| Date | Status | Borrower | Loan Amount |
|---|---|---|---|
| Previous Owner | Orr Lesmer | $103,200 | |
| Previous Owner | Orr Lesmer | $19,350 | |
| Previous Owner | Jackson Darrell | $99,920 |
Source: Public Records
Tax History Compared to Growth
Tax History
| Year | Tax Paid | Tax Assessment Tax Assessment Total Assessment is a certain percentage of the fair market value that is determined by local assessors to be the total taxable value of land and additions on the property. | Land | Improvement |
|---|---|---|---|---|
| 2024 | $3,058 | $130,760 | $24,800 | $105,960 |
| 2023 | $3,058 | $130,600 | $23,400 | $107,200 |
| 2022 | $2,541 | $99,880 | $18,000 | $81,880 |
| 2021 | $2,054 | $75,360 | $14,840 | $60,520 |
| 2020 | $2,095 | $75,360 | $14,840 | $60,520 |
| 2019 | $1,949 | $73,000 | $14,840 | $58,160 |
| 2018 | $1,784 | $64,600 | $13,440 | $51,160 |
| 2017 | $1,723 | $60,320 | $13,840 | $46,480 |
| 2016 | $1,664 | $56,280 | $13,440 | $42,840 |
| 2015 | $1,666 | $54,760 | $13,440 | $41,320 |
| 2014 | $1,304 | $42,160 | $11,200 | $30,960 |
| 2013 | -- | $41,720 | $11,200 | $30,520 |
Source: Public Records
Map
Nearby Homes
- 2425 River Place Crossing
- 2306 Old Lower River Rd
- 3380 Palmer Lake
- 3540 Lindsy Brooke Ct
- 2070 Woodmont Dr
- 3760 Lindsy Brooke Ct
- 3387 Surveyor Ct
- Reynold Plan at Palmer Falls
- 3677 Thornhill Ct
- 3687 Thornhill Ct
- 3664 Thornhill Ct
- Somerset III Plan at Palmer Falls
- 3544 Palmer Falls Dr
- 3327 Surveyor Ct
- 0 Mountain Dr Off & 0 Hunt Rd Ga Unit 10568792
- 3243 Bakewell St
- 3251 Blackley Old Rd
- 3841 Chattahoochee Dr
- 2374 Old Lower River Rd
- 2394 Old Lower River Rd Unit I
- 2366 Old Lower River Rd
- 2404 Old Lower River Rd Unit 1
- 2410 Old Lower River Rd
- 2352 Old Lower River Rd
- 2346 Old Lower River Rd
- 2455 River Place Crossing
- 2335 Old Lower River Rd
- 2445 River Place Crossing
- 2340 Old Lower River Rd Unit 1
- 2340 Old Lower River Rd
- 2435 River Place Crossing
- 2409 Old Lower River Rd
- 3641 Leah Place
- 2465 River Place Crossing Unit 1
- 2325 Old Lower River Rd
- 3530 Palmer Lake Point
- 3530 Palmer Lake Pointe
- 2328 Old Lower River Rd