2385 Eagle Pointe Ct Unit 2 Lawrenceville, GA 30044
Estimated Value: $355,000 - $373,000
3
Beds
3
Baths
2,011
Sq Ft
$181/Sq Ft
Est. Value
About This Home
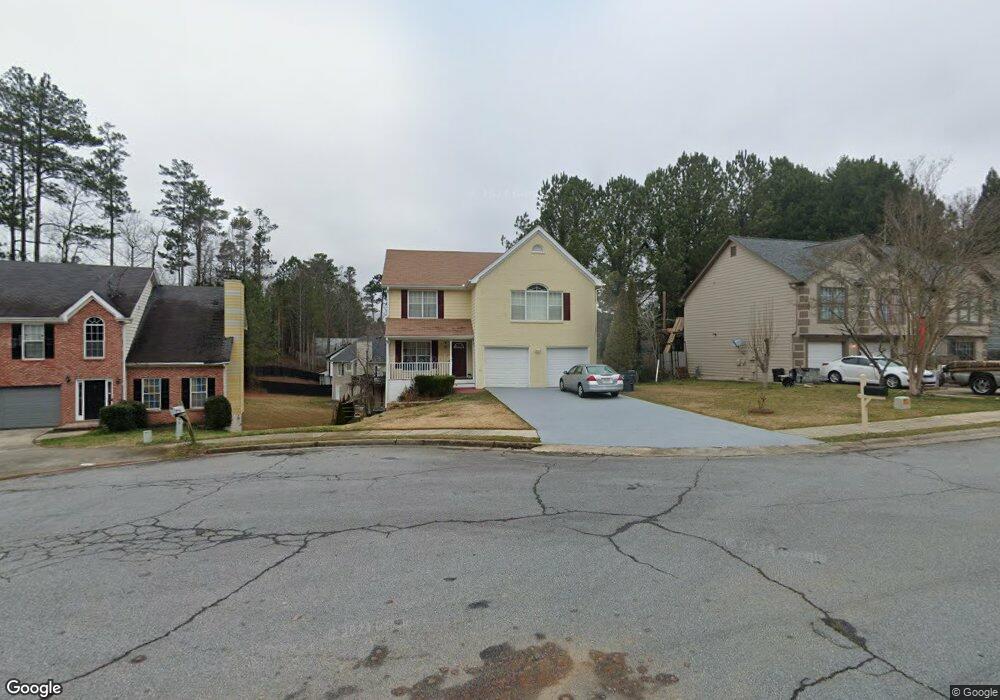
This home is located at 2385 Eagle Pointe Ct Unit 2, Lawrenceville, GA 30044 and is currently estimated at $364,079, approximately $181 per square foot. 2385 Eagle Pointe Ct Unit 2 is a home located in Gwinnett County with nearby schools including Baggett Elementary School, Richards Middle School, and Discovery High School.
Ownership History
Date
Name
Owned For
Owner Type
Purchase Details
Closed on
Feb 23, 2001
Sold by
Rowe Robert W and Rowe Marion A
Bought by
Persuad Ramesh C and Persuad Hameragie
Current Estimated Value
Home Financials for this Owner
Home Financials are based on the most recent Mortgage that was taken out on this home.
Original Mortgage
$136,800
Outstanding Balance
$48,825
Interest Rate
7.09%
Mortgage Type
New Conventional
Estimated Equity
$315,254
Purchase Details
Closed on
Feb 20, 2001
Sold by
Pandya Dhaivat and Pandya Bharvi
Bought by
Quintana Pablo and Quintana Cicely
Home Financials for this Owner
Home Financials are based on the most recent Mortgage that was taken out on this home.
Original Mortgage
$136,800
Outstanding Balance
$48,825
Interest Rate
7.09%
Mortgage Type
New Conventional
Estimated Equity
$315,254
Purchase Details
Closed on
Dec 11, 1995
Sold by
Denney Const Co
Bought by
Rowe Marion A Robert G
Create a Home Valuation Report for This Property
The Home Valuation Report is an in-depth analysis detailing your home's value as well as a comparison with similar homes in the area
Home Values in the Area
Average Home Value in this Area
Purchase History
| Date | Buyer | Sale Price | Title Company |
|---|---|---|---|
| Persuad Ramesh C | $144,000 | -- | |
| Quintana Pablo | $167,000 | -- | |
| Rowe Marion A Robert G | $119,000 | -- |
Source: Public Records
Mortgage History
| Date | Status | Borrower | Loan Amount |
|---|---|---|---|
| Open | Persuad Ramesh C | $136,800 | |
| Closed | Quintana Pablo | $100,000 |
Source: Public Records
Tax History
| Year | Tax Paid | Tax Assessment Tax Assessment Total Assessment is a certain percentage of the fair market value that is determined by local assessors to be the total taxable value of land and additions on the property. | Land | Improvement |
|---|---|---|---|---|
| 2025 | $1,004 | $165,840 | $21,600 | $144,240 |
| 2024 | $1,002 | $157,440 | $21,600 | $135,840 |
| 2023 | $1,002 | $155,160 | $27,200 | $127,960 |
| 2022 | $951 | $131,800 | $23,200 | $108,600 |
| 2021 | $939 | $107,520 | $17,600 | $89,920 |
| 2020 | $936 | $95,360 | $15,320 | $80,040 |
| 2019 | $868 | $95,360 | $15,320 | $80,040 |
| 2018 | $849 | $83,960 | $12,760 | $71,200 |
| 2016 | $2,383 | $70,440 | $11,200 | $59,240 |
| 2015 | $2,062 | $55,040 | $8,400 | $46,640 |
| 2014 | -- | $55,040 | $8,400 | $46,640 |
Source: Public Records
Map
Nearby Homes
- 775 Terrace Trace Unit 1
- 2385 Waterford Park Dr
- 860 Regency Ct
- 1107 Glen Chase Dr
- 775 Shannon Way
- 840 Melrose Park Place
- 1110 Meadow Walk Ave
- 914 Wenham Ln
- 933 Spicy Oak Dr
- 2209 Reserve Park Ln
- 2219 Reserve Park Ln
- 2193 Waterford Park Dr
- 959 Briarleigh Ct
- 2060 Eagle Nest Bluff
- 841 Woods Ct
- 1277 Parkside Club Dr Unit 1
- 2572 Pembrooke Way Unit 4
- 2127 Steffi Ln Unit 5
- 2191 Plantation Ct
- 1210 Herrington Rd
- 2375 Eagle Pointe Ct
- 2395 Eagle Pointe Ct NW
- 2395 Eagle Pointe Ct
- 1001 Eagle View
- 2365 Eagle Pointe Ct Unit 2
- 2405 Eagle Pointe Ct
- 1016 Eagle View NW
- 1016 Eagle View
- 2400 Eagle Pointe Ct NW Unit 19
- 1011 Eagle View Unit 2
- 2380 Eagle Pointe Ct Unit 2
- 2370 Eagle Pointe Ct Unit 2
- 2390 Eagle Pointe Ct Unit 2
- 2238 Newbury Oaks Dr
- 2400 Eagle Pointe Ct
- 2400 Eagle Pointe Ct Unit 19
- 2355 Eagle Pointe Ct
- 2258 Newbury Oaks Dr
- 2360 Eagle Pointe Ct
- 2268 Newbury Oaks Dr
Your Personal Tour Guide
Ask me questions while you tour the home.