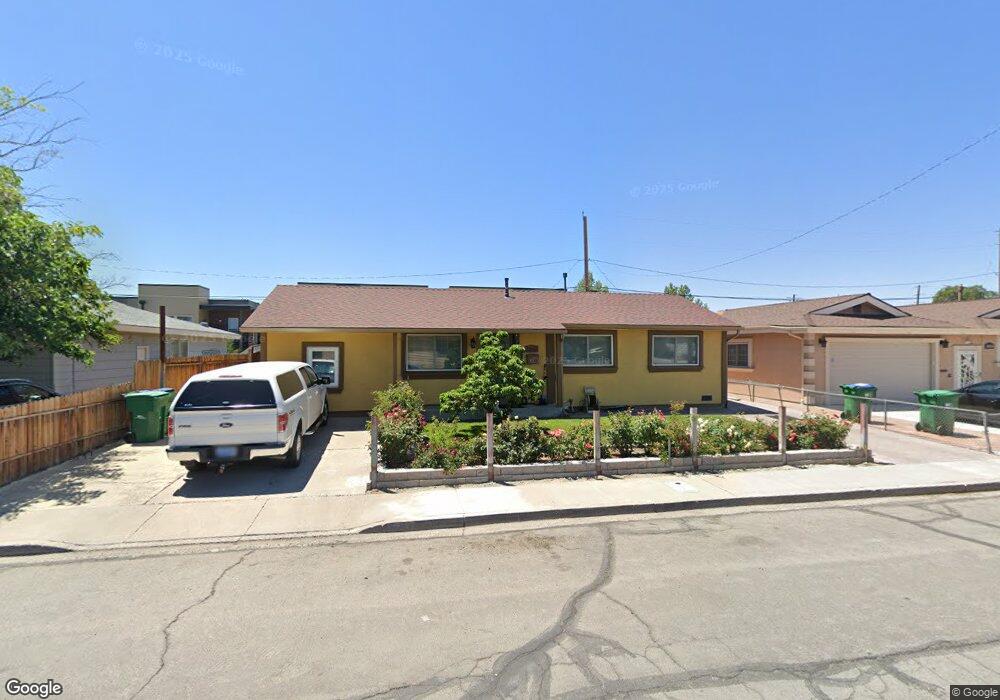
2385 Jessie Ave Sparks, NV 89431
Downtown Sparks NeighborhoodEstimated Value: $322,000 - $386,000
3
Beds
2
Baths
988
Sq Ft
$354/Sq Ft
Est. Value
About This Home
This home is located at 2385 Jessie Ave, Sparks, NV 89431 and is currently estimated at $350,174, approximately $354 per square foot. 2385 Jessie Ave is a home located in Washoe County with nearby schools including Agnes Risley Elementary School, Sparks Middle School, and Sparks High School.
Ownership History
Date
Name
Owned For
Owner Type
Purchase Details
Closed on
May 26, 1995
Sold by
Rogers Bret A
Bought by
Gallegos Francisco and Gallegos Margarita
Current Estimated Value
Home Financials for this Owner
Home Financials are based on the most recent Mortgage that was taken out on this home.
Original Mortgage
$87,168
Interest Rate
8.43%
Mortgage Type
FHA
Purchase Details
Closed on
May 22, 1995
Sold by
Obear Rogers Donna J and Rogers Benjamin C
Bought by
Rogers Bret A
Home Financials for this Owner
Home Financials are based on the most recent Mortgage that was taken out on this home.
Original Mortgage
$87,168
Interest Rate
8.43%
Mortgage Type
FHA
Purchase Details
Closed on
Mar 2, 1994
Sold by
Obear Rogers Donna J
Bought by
Rogers Benjamin C and Rogers Edith
Create a Home Valuation Report for This Property
The Home Valuation Report is an in-depth analysis detailing your home's value as well as a comparison with similar homes in the area
Home Values in the Area
Average Home Value in this Area
Purchase History
| Date | Buyer | Sale Price | Title Company |
|---|---|---|---|
| Gallegos Francisco | $88,000 | First Centennial Title Co | |
| Rogers Bret A | -- | First Centennial Title Co | |
| Rogers Benjamin C | -- | -- |
Source: Public Records
Mortgage History
| Date | Status | Borrower | Loan Amount |
|---|---|---|---|
| Closed | Gallegos Francisco | $87,168 |
Source: Public Records
Tax History Compared to Growth
Tax History
| Year | Tax Paid | Tax Assessment Tax Assessment Total Assessment is a certain percentage of the fair market value that is determined by local assessors to be the total taxable value of land and additions on the property. | Land | Improvement |
|---|---|---|---|---|
| 2025 | $769 | $55,738 | $36,085 | $19,653 |
| 2024 | $769 | $53,369 | $33,880 | $19,489 |
| 2023 | $750 | $49,113 | $31,325 | $17,788 |
| 2022 | $730 | $42,119 | $27,580 | $14,539 |
| 2021 | $709 | $31,919 | $17,885 | $14,034 |
| 2020 | $687 | $31,424 | $17,430 | $13,994 |
| 2019 | $667 | $29,274 | $15,855 | $13,419 |
| 2018 | $646 | $23,983 | $11,060 | $12,923 |
| 2017 | $624 | $22,180 | $9,345 | $12,835 |
| 2016 | $607 | $21,282 | $8,365 | $12,917 |
| 2015 | $459 | $20,671 | $7,945 | $12,726 |
| 2014 | $494 | $15,691 | $6,230 | $9,461 |
| 2013 | -- | $13,149 | $3,955 | $9,194 |
Source: Public Records
Map
Nearby Homes
- 2405 Jessie Ave
- 2365 Jessie Ave
- 2345 Jessie Ave
- 2415 Jessie Ave
- 2380 Jessie Ave
- 2360 Jessie Ave
- 2398 Pauline Ave
- 2398 E Pauline Ave Sparks Nv 89431
- 2338 Greyhaven Ln
- 2325 Jessie Ave
- 2340 Jessie Ave
- 2294 Cannonball Rd
- 2288 Cannonball Rd
- 1040 El Rancho Dr
- 2396 Pauline Ave
- 2282 Cannonball Rd
- 2365 Pauline Ave
- 2320 Jessie Ave
- 2276 Cannonball Rd
- 2305 Jessie Ave