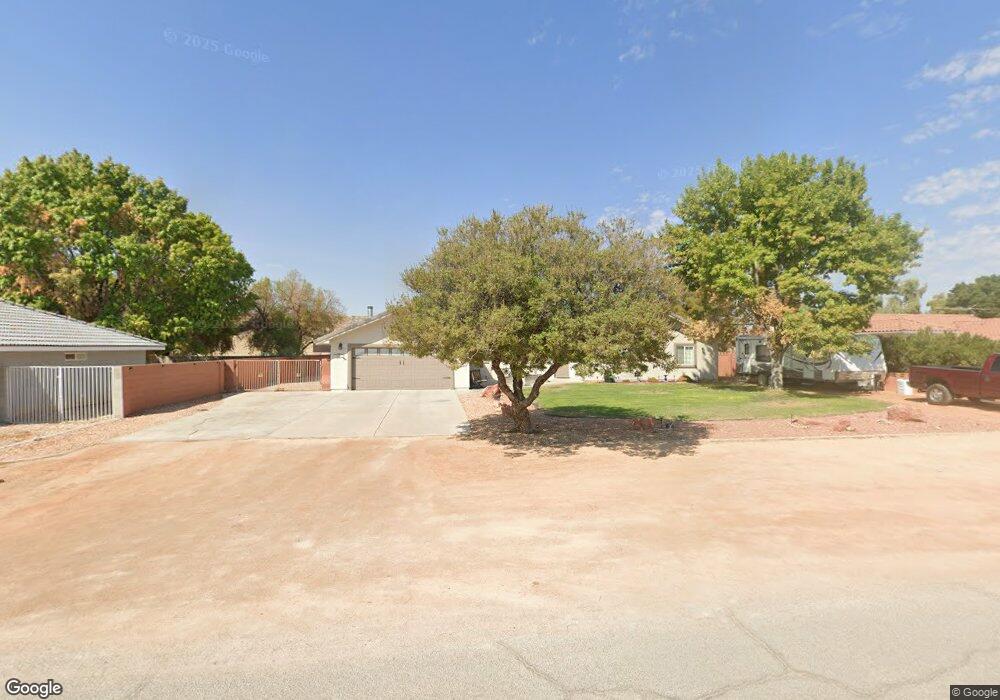
2385 Robison Farm Rd Logandale, NV 89021
Estimated Value: $514,406 - $613,000
4
Beds
4
Baths
2,800
Sq Ft
$196/Sq Ft
Est. Value
About This Home
This home is located at 2385 Robison Farm Rd, Logandale, NV 89021 and is currently estimated at $549,602, approximately $196 per square foot. 2385 Robison Farm Rd is a home with nearby schools including Grant Bowler Elementary School, Mack Lyon Middle School, and Moapa Valley High School.
Ownership History
Date
Name
Owned For
Owner Type
Purchase Details
Closed on
Jul 15, 2019
Sold by
Boss Nathan R and Boss Rorie A
Bought by
Abbott Kenneth and Abbott Pamela A
Current Estimated Value
Home Financials for this Owner
Home Financials are based on the most recent Mortgage that was taken out on this home.
Original Mortgage
$359,484
Outstanding Balance
$314,940
Interest Rate
3.82%
Mortgage Type
VA
Estimated Equity
$234,662
Purchase Details
Closed on
Apr 26, 2007
Sold by
Boss Nathan R and Boss Rorie A
Bought by
Boss Nathan R and Boss Rorie A
Purchase Details
Closed on
Jun 8, 2004
Sold by
Lara James C and Lara Ann C
Bought by
Boss Nathan R and Boss Rorie A
Home Financials for this Owner
Home Financials are based on the most recent Mortgage that was taken out on this home.
Original Mortgage
$231,900
Interest Rate
6%
Mortgage Type
Unknown
Purchase Details
Closed on
Apr 6, 1998
Sold by
Robison Gary A and Robison Julie
Bought by
Lara James C and Lara Ann C
Home Financials for this Owner
Home Financials are based on the most recent Mortgage that was taken out on this home.
Original Mortgage
$187,975
Interest Rate
7.18%
Mortgage Type
VA
Create a Home Valuation Report for This Property
The Home Valuation Report is an in-depth analysis detailing your home's value as well as a comparison with similar homes in the area
Home Values in the Area
Average Home Value in this Area
Purchase History
| Date | Buyer | Sale Price | Title Company |
|---|---|---|---|
| Abbott Kenneth | $348,000 | Nevada State Title | |
| Boss Nathan R | -- | None Available | |
| Boss Nathan R | $289,900 | Nevada Title Company | |
| Lara James C | $182,500 | Land Title |
Source: Public Records
Mortgage History
| Date | Status | Borrower | Loan Amount |
|---|---|---|---|
| Open | Abbott Kenneth | $359,484 | |
| Previous Owner | Boss Nathan R | $231,900 | |
| Previous Owner | Lara James C | $187,975 | |
| Closed | Boss Nathan R | $43,505 |
Source: Public Records
Tax History Compared to Growth
Tax History
| Year | Tax Paid | Tax Assessment Tax Assessment Total Assessment is a certain percentage of the fair market value that is determined by local assessors to be the total taxable value of land and additions on the property. | Land | Improvement |
|---|---|---|---|---|
| 2025 | $1,958 | $111,439 | $17,115 | $94,324 |
| 2024 | $1,902 | $111,439 | $17,115 | $94,324 |
| 2023 | $1,902 | $103,459 | $14,175 | $89,284 |
| 2022 | $1,847 | $93,237 | $11,638 | $81,599 |
| 2021 | $1,874 | $88,990 | $11,025 | $77,965 |
| 2020 | $1,718 | $88,596 | $11,025 | $77,571 |
| 2019 | $1,610 | $87,231 | $10,500 | $76,731 |
| 2018 | $1,537 | $83,470 | $9,625 | $73,845 |
| 2017 | $2,134 | $84,468 | $9,625 | $74,843 |
| 2016 | $1,461 | $73,106 | $8,750 | $64,356 |
| 2015 | $1,459 | $71,587 | $8,750 | $62,837 |
| 2014 | $1,417 | $53,510 | $8,750 | $44,760 |
Source: Public Records
Map
Nearby Homes
- 2925 Rice St
- 2770 Taylor St
- 1917 N Moapa Valley Blvd
- 1 N Heyer St
- 0 N Heyer St
- 985 Hinckley Ave
- 1990 Liston Ave
- 1141 Thomas Bay Cir
- 1625 Metcalf Dr
- 921 Gubler Ave
- 0 Moapa Valley
- 0 N Yamashita St
- 1140 Mahoney Ave
- 1635 Zubia St
- 0 W Cram Ave
- 0 0 Ash and Diane Unit 2681485
- 2030 Ash St
- 1470 St Joseph St
- 0 Diane Ave
- 285 Pat Ave
- 2401 Robison Farm Rd
- 1680 Cappalappa Ave
- 1662 Cappalappa Ave
- 2433 Robison Farm Rd
- 2390 Robison Farm Rd
- 1698 Cappalappa Ave
- 2410 Robison Farm Rd
- 1630 Cappalappa Ave
- 2430 Robison Farm Rd
- 2443 Robison Farm Rd
- 1620 Cappalappa Ave
- 1665 Cappalappa Ave
- 1695 Cappalappa Ave
- 2440 Robison Farm Dr
- 1685 Cappalappa Ave
- 1720 Cappalappa Ave
- 1625 Cappalappa Ave
- 1610 Cappalappa Ave
- 2453 Robison Farm Rd
- 2450 Robison Farm Rd