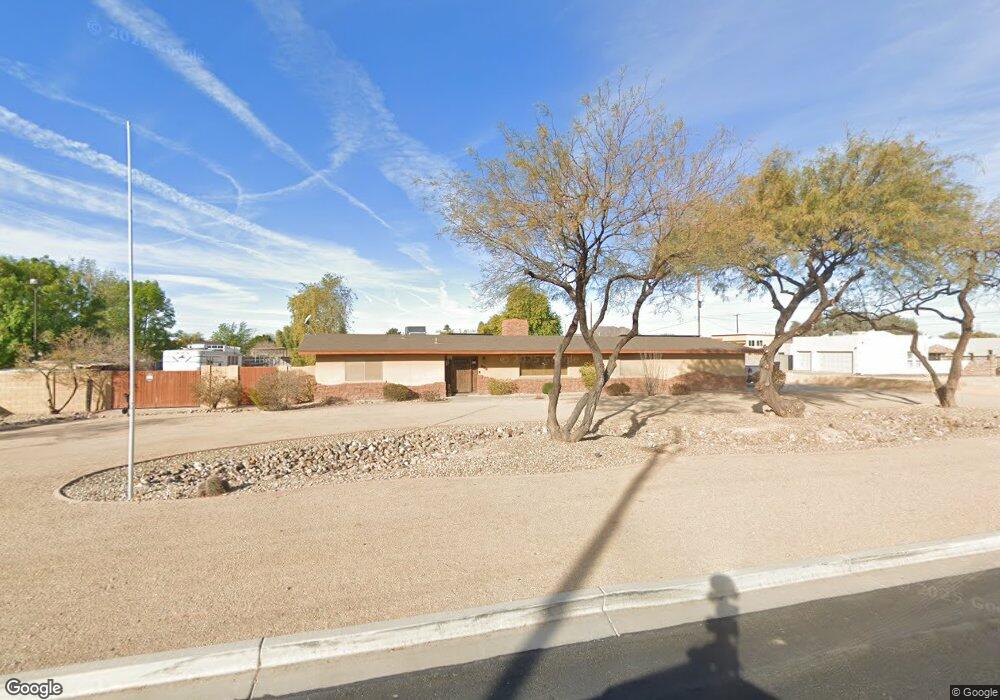
23850 N 70th Ave Peoria, AZ 85383
Estimated Value: $751,488 - $950,000
3
Beds
3
Baths
2,600
Sq Ft
$314/Sq Ft
Est. Value
About This Home
This home is located at 23850 N 70th Ave, Peoria, AZ 85383 and is currently estimated at $816,622, approximately $314 per square foot. 23850 N 70th Ave is a home located in Maricopa County with nearby schools including Copper Creek Elementary School, Hillcrest Middle School, and Mountain Ridge High School.
Ownership History
Date
Name
Owned For
Owner Type
Purchase Details
Closed on
Mar 16, 2021
Sold by
Delung James Robert and Delung Erin Theresa
Bought by
Delung James R and Delung Erin T
Current Estimated Value
Home Financials for this Owner
Home Financials are based on the most recent Mortgage that was taken out on this home.
Original Mortgage
$235,000
Outstanding Balance
$211,016
Interest Rate
2.8%
Mortgage Type
New Conventional
Estimated Equity
$605,606
Purchase Details
Closed on
Jul 27, 2017
Sold by
Delung James R and Delung Erin Tm
Bought by
Delung James R and Delung Erin Tm
Purchase Details
Closed on
Dec 4, 2012
Sold by
Delung James R
Bought by
Delung James R and Delung Erin T M
Home Financials for this Owner
Home Financials are based on the most recent Mortgage that was taken out on this home.
Original Mortgage
$273,200
Interest Rate
3.36%
Mortgage Type
New Conventional
Purchase Details
Closed on
Jan 27, 2010
Sold by
Delung James R
Bought by
Delung James R and Delung Erin T M
Purchase Details
Closed on
Jul 30, 2003
Sold by
Phillips Karen
Bought by
Phillips Karen and Phillips Patrick
Home Financials for this Owner
Home Financials are based on the most recent Mortgage that was taken out on this home.
Original Mortgage
$212,000
Interest Rate
7.5%
Mortgage Type
Purchase Money Mortgage
Purchase Details
Closed on
Jun 26, 2003
Sold by
Northrup Gen K
Bought by
Shaw David A and Shaw Becky
Home Financials for this Owner
Home Financials are based on the most recent Mortgage that was taken out on this home.
Original Mortgage
$212,000
Interest Rate
7.5%
Mortgage Type
Purchase Money Mortgage
Purchase Details
Closed on
Jan 12, 2000
Sold by
International Technology Transfers
Bought by
Northrup Gen K
Home Financials for this Owner
Home Financials are based on the most recent Mortgage that was taken out on this home.
Original Mortgage
$120,000
Interest Rate
7.83%
Purchase Details
Closed on
Oct 25, 1999
Sold by
International Technology Transfer
Bought by
Capital Acquisition Llc
Purchase Details
Closed on
Jun 9, 1997
Sold by
Guiliani Louis J and Guiliani Mabel Alberta
Bought by
Jenson Von K and Northrup Gen
Purchase Details
Closed on
May 17, 1995
Sold by
Guiliani Louis J and Guiliani Mabel Alberta
Bought by
Guiliani Louis J and Guiliani Mabel Alberta
Create a Home Valuation Report for This Property
The Home Valuation Report is an in-depth analysis detailing your home's value as well as a comparison with similar homes in the area
Home Values in the Area
Average Home Value in this Area
Purchase History
| Date | Buyer | Sale Price | Title Company |
|---|---|---|---|
| Delung James R | -- | Accommodation | |
| Delung James Robert | -- | American Title Svc Agcy Llc | |
| Delung James R | -- | None Available | |
| Delung James R | -- | Fidelity National Title Agen | |
| Delung James R | -- | Fidelity National Title Agen | |
| Delung James R | -- | Lawyers Title Of Arizona Inc | |
| Delung James R | $265,000 | Lawyers Title Of Arizona Inc | |
| Phillips Karen | -- | -- | |
| Shaw David A | $280,000 | Security Title Agency | |
| Northrup Gen K | -- | Chicago Title Insurance Co | |
| International Technology Transfers | -- | Chicago Title Insurance Co | |
| Capital Acquisition Llc | -- | -- | |
| Jenson Von K | $40,000 | North American Title Agency | |
| Guiliani Louis J | -- | -- |
Source: Public Records
Mortgage History
| Date | Status | Borrower | Loan Amount |
|---|---|---|---|
| Open | Delung James Robert | $235,000 | |
| Previous Owner | Delung James R | $273,200 | |
| Previous Owner | Phillips Karen | $212,000 | |
| Previous Owner | Shaw David A | $224,000 | |
| Previous Owner | Northrup Gen K | $120,000 |
Source: Public Records
Tax History Compared to Growth
Tax History
| Year | Tax Paid | Tax Assessment Tax Assessment Total Assessment is a certain percentage of the fair market value that is determined by local assessors to be the total taxable value of land and additions on the property. | Land | Improvement |
|---|---|---|---|---|
| 2025 | $2,904 | $36,047 | -- | -- |
| 2024 | $2,835 | $34,330 | -- | -- |
| 2023 | $2,835 | $55,610 | $11,120 | $44,490 |
| 2022 | $2,728 | $41,400 | $8,280 | $33,120 |
| 2021 | $2,866 | $37,860 | $7,570 | $30,290 |
| 2020 | $2,817 | $35,280 | $7,050 | $28,230 |
| 2019 | $2,733 | $32,910 | $6,580 | $26,330 |
| 2018 | $2,638 | $31,360 | $6,270 | $25,090 |
| 2017 | $2,545 | $30,120 | $6,020 | $24,100 |
| 2016 | $2,397 | $27,950 | $5,590 | $22,360 |
| 2015 | $2,207 | $27,260 | $5,450 | $21,810 |
Source: Public Records
Map
Nearby Homes
- 6937 W Avenida Del Sol
- 7264 W Cielo Grande
- 6994 W Monte Lindo
- 7281 W Cielo Grande
- 6941 W Monte Lindo
- 6935 W Monte Lindo
- 6911 W Monte Lindo
- 23307 N 71st Dr
- 7110 W Villa Lindo Dr
- 7309 W Artie Ave
- 6923 W Villa Chula
- 24016 N 66th Ln
- 6610 W Leiber Place
- 6604 W Leiber Place
- 7205 W Fallen Leaf Ln
- 7563 W Electra Ln
- 24213 N 65th Ave Unit 28
- 6608 W Saguaro Park Ln
- 22727 N 73rd Dr
- 7274 W Donald Dr
- 7000 W Avenida Del Sol Unit 57
- 7000 W Avenida Del Sol Unit 3
- 23900 N 70th Ave
- 6995 W Avenida Del Sol
- 23950 N 70th Ave
- 23845 N 71st Ave
- XXXX W Avenida Del Sol -- Unit 201-13-050-H & J
- 0000 W No Address Assigned Rd
- 0000 W No Address Assigned Rd
- 69XX W Avenida Del Sol -- Unit 201-13-050HJ
- 6987 W Mariposa Grande Ln
- 6938 W Avenida Del Sol
- 23925 N 71st Ave
- 23980 N 70th Ave
- 7015 W Mariposa Grande
- 6925 W Mariposa Grande Unit 1
- 6915 W Mariposa Grande Unit 1
- 6913 W Mariposa Grande Unit 1
- 7045 W Cielo Grande
- 6905 W Mariposa Grande Unit 1