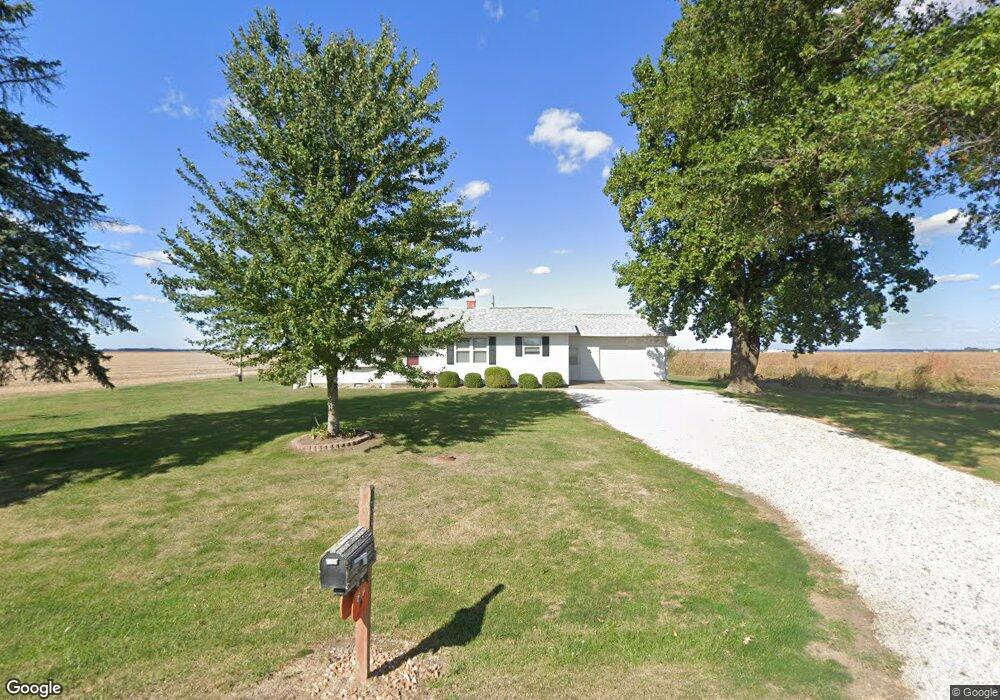
2386 Bosier Rd Jacksonville, IL 62650
Estimated Value: $135,000 - $150,295
2
Beds
2
Baths
1,100
Sq Ft
$129/Sq Ft
Est. Value
About This Home
This home is located at 2386 Bosier Rd, Jacksonville, IL 62650 and is currently estimated at $141,824, approximately $128 per square foot. 2386 Bosier Rd is a home located in Morgan County with nearby schools including Jacksonville High School.
Ownership History
Date
Name
Owned For
Owner Type
Purchase Details
Closed on
Sep 20, 2021
Sold by
Becker Brandon C
Bought by
Logsdon Richard J and Logsdon Sheila D
Current Estimated Value
Purchase Details
Closed on
Sep 11, 2017
Sold by
Mattes Daniel M and Mattes Laurie K
Bought by
Becker Brandon C
Home Financials for this Owner
Home Financials are based on the most recent Mortgage that was taken out on this home.
Original Mortgage
$89,300
Interest Rate
4.65%
Mortgage Type
Future Advance Clause Open End Mortgage
Purchase Details
Closed on
May 26, 2010
Sold by
Hutchison Betsy Ann and Armstrong Mailey Katie Jelane
Bought by
Mattes Daniel M and Stratton Laurie K
Home Financials for this Owner
Home Financials are based on the most recent Mortgage that was taken out on this home.
Original Mortgage
$62,400
Interest Rate
5.13%
Mortgage Type
Future Advance Clause Open End Mortgage
Create a Home Valuation Report for This Property
The Home Valuation Report is an in-depth analysis detailing your home's value as well as a comparison with similar homes in the area
Home Values in the Area
Average Home Value in this Area
Purchase History
| Date | Buyer | Sale Price | Title Company |
|---|---|---|---|
| Logsdon Richard J | $110,000 | Attorney | |
| Becker Brandon C | $94,000 | Attorney | |
| Mattes Daniel M | $78,000 | None Available |
Source: Public Records
Mortgage History
| Date | Status | Borrower | Loan Amount |
|---|---|---|---|
| Previous Owner | Becker Brandon C | $89,300 | |
| Previous Owner | Mattes Daniel M | $62,400 |
Source: Public Records
Tax History Compared to Growth
Tax History
| Year | Tax Paid | Tax Assessment Tax Assessment Total Assessment is a certain percentage of the fair market value that is determined by local assessors to be the total taxable value of land and additions on the property. | Land | Improvement |
|---|---|---|---|---|
| 2024 | $3,071 | $41,920 | $2,750 | $39,170 |
| 2023 | $3,054 | $38,110 | $2,500 | $35,610 |
| 2022 | $2,813 | $38,110 | $2,500 | $35,610 |
| 2021 | $1,684 | $29,480 | $2,550 | $26,930 |
| 2020 | $1,555 | $27,030 | $2,550 | $24,480 |
| 2019 | $1,466 | $25,860 | $2,550 | $23,310 |
| 2018 | $1,422 | $25,860 | $2,550 | $23,310 |
| 2017 | $1,407 | $25,860 | $2,550 | $23,310 |
| 2016 | $1,417 | $25,860 | $2,550 | $23,310 |
| 2015 | $1,471 | $25,860 | $2,550 | $23,310 |
| 2014 | $1,471 | $33,300 | $1,290 | $32,010 |
| 2013 | $1,968 | $33,300 | $1,290 | $32,010 |
Source: Public Records
Map
Nearby Homes
- 0 Gray Rd
- 2 Springwater Dr
- 17 Springwater Dr
- 12 Quail Ln
- 68 Applebee Farms Dr Unit Apple
- 64 Applebee Farms Dr
- 66 Applebee Farms Dr
- 72 Applebee Farms Dr
- 619-621 Hooker St
- None None Ave
- 0 Beilschmidt Rd
- 1001 Cox St
- 697 E State St
- 636 N East St
- 617 N East St
- 509 E Douglas Ave
- 607 N East St
- 124 E Wolcott St
- 6 Fernwood Blvd
- 544 Hardin Ave