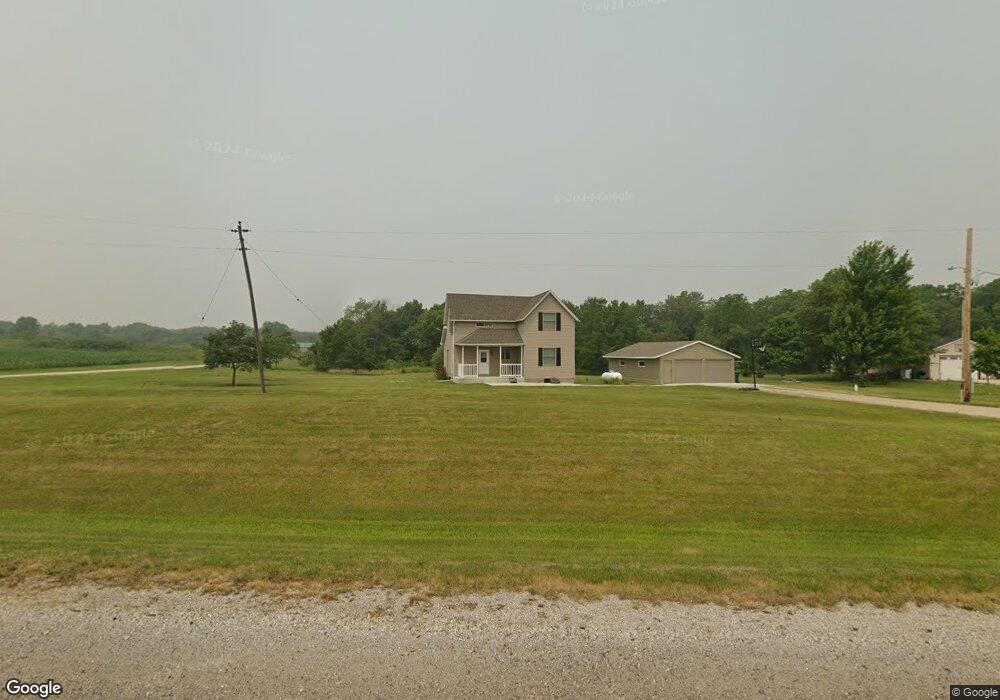
2387 E 29th Rd Seneca, IL 61360
Estimated Value: $188,000 - $252,000
Studio
--
Bath
1,576
Sq Ft
$144/Sq Ft
Est. Value
About This Home
This home is located at 2387 E 29th Rd, Seneca, IL 61360 and is currently estimated at $227,535, approximately $144 per square foot. 2387 E 29th Rd is a home with nearby schools including Seneca Grade School, Seneca Grade School - South Campus, and Seneca High School.
Ownership History
Date
Name
Owned For
Owner Type
Purchase Details
Closed on
Sep 1, 2021
Sold by
Ugolini Michael P and Ugolini Jackie L
Bought by
Greenan Adam L
Current Estimated Value
Home Financials for this Owner
Home Financials are based on the most recent Mortgage that was taken out on this home.
Original Mortgage
$171,830
Outstanding Balance
$157,242
Interest Rate
3.75%
Mortgage Type
FHA
Estimated Equity
$70,293
Purchase Details
Closed on
Jun 19, 2020
Sold by
Hendershott David L
Bought by
Ugolini Michael P and Ugolini Jasckie
Purchase Details
Closed on
Aug 29, 2007
Sold by
Ugolini Michael P and Ugolini Jackie L
Bought by
Hendershott David L
Home Financials for this Owner
Home Financials are based on the most recent Mortgage that was taken out on this home.
Original Mortgage
$126,000
Interest Rate
6.79%
Mortgage Type
New Conventional
Create a Home Valuation Report for This Property
The Home Valuation Report is an in-depth analysis detailing your home's value as well as a comparison with similar homes in the area
Home Values in the Area
Average Home Value in this Area
Purchase History
| Date | Buyer | Sale Price | Title Company |
|---|---|---|---|
| Greenan Adam L | $175,000 | None Available | |
| Ugolini Michael P | $90,000 | None Available | |
| Hendershott David L | $126,000 | None Available |
Source: Public Records
Mortgage History
| Date | Status | Borrower | Loan Amount |
|---|---|---|---|
| Open | Greenan Adam L | $171,830 | |
| Previous Owner | Hendershott David L | $126,000 |
Source: Public Records
Tax History
| Year | Tax Paid | Tax Assessment Tax Assessment Total Assessment is a certain percentage of the fair market value that is determined by local assessors to be the total taxable value of land and additions on the property. | Land | Improvement |
|---|---|---|---|---|
| 2024 | $2,946 | $66,910 | $9,809 | $57,101 |
| 2023 | $2,581 | $59,102 | $8,664 | $50,438 |
| 2022 | $2,375 | $54,352 | $7,968 | $46,384 |
| 2021 | $1,504 | $30,417 | $7,249 | $23,168 |
| 2020 | $1,194 | $30,326 | $7,227 | $23,099 |
| 2019 | $1,161 | $29,414 | $7,010 | $22,404 |
| 2018 | $950 | $25,124 | $6,800 | $18,324 |
| 2017 | $948 | $25,124 | $6,800 | $18,324 |
| 2016 | $945 | $25,124 | $6,800 | $18,324 |
| 2015 | $785 | $21,892 | $5,925 | $15,967 |
| 2012 | -- | $22,155 | $5,996 | $16,159 |
Source: Public Records
Map
Nearby Homes
- 2464 E 29th Rd Unit 3
- 2455 Brookfield Dr
- 2960 N 2553rd Rd
- 1221 S Fox Run
- Lot 56 Eagle Chase Dr
- 1 Logue Cir
- 470 Logue Cir
- 740 Daisy Ct
- 730 Daisy Ct
- 710 Daisy Ct
- 281 S Main St
- 187 W Union St
- 368 Crotty Ave
- Lot 3 W Indian Trail Rd
- 2795 E 28th Lot 1093 Rd
- 2795 E 28th Lot 578 Rd
- 000 Brichlawn Place
- 2795 E 28th Lot 648 Rd
- 2795 E 28th Lot 720 Rd
- 2795 E 28th Lot 1205 Rd
- 2371 Il-170
- 2389 E 29th Rd
- 2393 E 29th Rd
- 2395 E 29th Rd
- 2361 State Route 170
- 2401 E 29th Rd
- 2371 E 29th Rd
- 2381 E 29th Rd
- 2396 E 29th Rd
- 2408 E 29th Rd
- 2397 State Route 170
- 2413 E 29th Rd
- 2361 E 29th Rd
- 2412 E 29th Rd Unit RD0
- 2415 E 29th Rd
- 2414 E 29th Rd
- 2417 E 29th Rd
- 2416 E 29th Rd
- 2419 E 29th Rd
- 2420 E 29th Rd
Your Personal Tour Guide
Ask me questions while you tour the home.