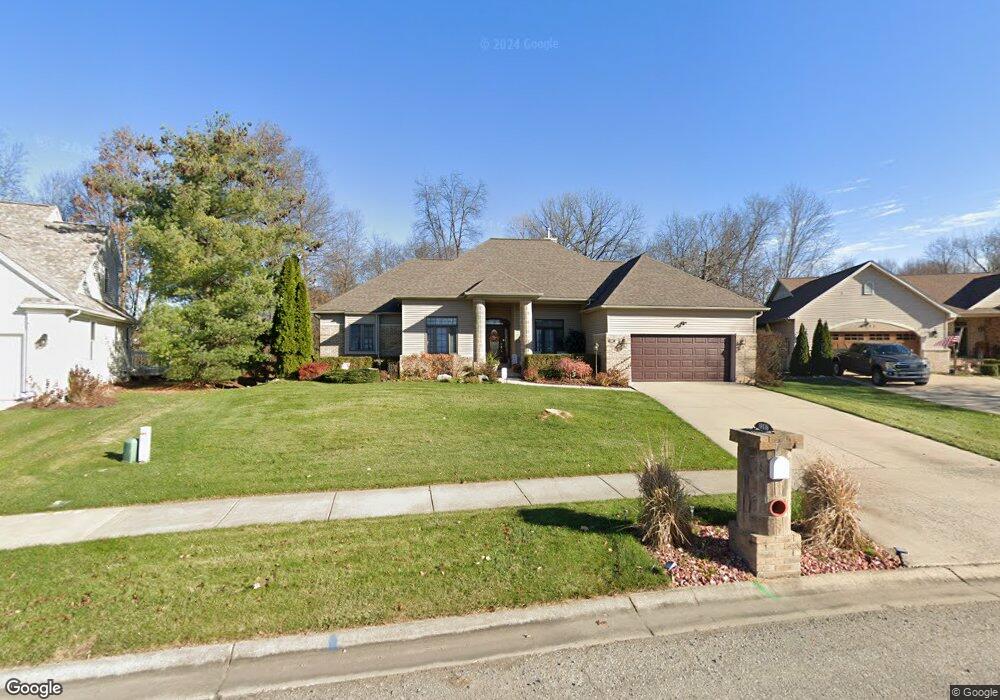
2387 Houghton Hollow Dr Lansing, MI 48911
Estimated Value: $407,000 - $474,385
3
Beds
4
Baths
2,050
Sq Ft
$217/Sq Ft
Est. Value
About This Home
This home is located at 2387 Houghton Hollow Dr, Lansing, MI 48911 and is currently estimated at $445,596, approximately $217 per square foot. 2387 Houghton Hollow Dr is a home located in Ingham County with nearby schools including Horizon Elementary School, Washington Woods Middle School, and Holt Junior High School.
Ownership History
Date
Name
Owned For
Owner Type
Purchase Details
Closed on
Jun 16, 2014
Sold by
Houser Brian and Houser Amy
Bought by
Schneider Robert
Current Estimated Value
Home Financials for this Owner
Home Financials are based on the most recent Mortgage that was taken out on this home.
Original Mortgage
$130,000
Outstanding Balance
$40,476
Interest Rate
4.18%
Estimated Equity
$405,120
Purchase Details
Closed on
Sep 21, 2006
Sold by
Garcia Ramon A
Bought by
Houser Brian and Houser Amy
Home Financials for this Owner
Home Financials are based on the most recent Mortgage that was taken out on this home.
Original Mortgage
$272,000
Interest Rate
6.58%
Purchase Details
Closed on
Jun 2, 2005
Sold by
Thwaites Douglas B
Bought by
Garcia Ramon A
Purchase Details
Closed on
May 5, 2005
Sold by
Thwaites Douglas and The Construction Loan Co Inc
Bought by
Capital Community Cu
Purchase Details
Closed on
Jul 31, 2002
Sold by
Houghton Hollow Llc
Bought by
Thwaites Douglas B
Create a Home Valuation Report for This Property
The Home Valuation Report is an in-depth analysis detailing your home's value as well as a comparison with similar homes in the area
Home Values in the Area
Average Home Value in this Area
Purchase History
| Date | Buyer | Sale Price | Title Company |
|---|---|---|---|
| Schneider Robert | $295,000 | None Available | |
| Houser Brian | $340,000 | None Available | |
| Garcia Ramon A | $165,000 | Fatic | |
| Capital Community Cu | $147,806 | -- | |
| Thwaites Douglas B | $42,500 | First American Title |
Source: Public Records
Mortgage History
| Date | Status | Borrower | Loan Amount |
|---|---|---|---|
| Open | Schneider Robert | $130,000 | |
| Previous Owner | Houser Brian | $272,000 |
Source: Public Records
Tax History Compared to Growth
Tax History
| Year | Tax Paid | Tax Assessment Tax Assessment Total Assessment is a certain percentage of the fair market value that is determined by local assessors to be the total taxable value of land and additions on the property. | Land | Improvement |
|---|---|---|---|---|
| 2025 | $8,586 | $248,100 | $41,600 | $206,500 |
| 2024 | $21 | $236,100 | $32,200 | $203,900 |
| 2023 | $7,996 | $212,000 | $32,900 | $179,100 |
| 2022 | $7,631 | $182,900 | $28,500 | $154,400 |
| 2021 | $7,445 | $169,200 | $16,500 | $152,700 |
| 2020 | $7,556 | $161,200 | $16,500 | $144,700 |
| 2019 | $7,271 | $153,100 | $16,500 | $136,600 |
| 2018 | $7,229 | $145,900 | $16,500 | $129,400 |
| 2017 | $6,767 | $145,900 | $16,500 | $129,400 |
| 2016 | $6,613 | $145,800 | $22,500 | $123,300 |
| 2015 | $5,833 | $132,900 | $52,032 | $80,868 |
| 2014 | $5,833 | $121,600 | $52,032 | $69,568 |
Source: Public Records
Map
Nearby Homes
- 2416 Houghton Hollow Dr
- 5900 Macmillan Way
- 2626 Little Hickory Dr
- 2520 Renfrew Way
- 2340 Washington Rd
- 6810 Meese Dr
- 6947 Meese Dr
- 2360 Gilbert Rd
- 6125 Kenbrook Rd
- 2616 Michigan 99
- 6263 Marywood Ave
- 6270 S Washington Ave
- 6037 Hughes Rd
- 2411 Bliesener St
- 6955 Richard Rd
- 6444 Sommerset Rd
- The Windsor Plan at Meadow Ridge
- The Nantucket Plan at Meadow Ridge
- The Norway Plan at Meadow Ridge
- The Newton Plan at Meadow Ridge
- 2383 Houghton Hollow Dr
- 2391 Houghton Hollow Dr
- 2380 Houghton Hollow Dr
- 2395 Houghton Hollow Dr
- 2400 Houghton Hollow Dr
- 2399 Houghton Hollow Dr
- 5861 Horstmeyer Rd
- 2384 Houghton Hollow Dr
- 5875 Horstmeyer Rd
- 5851 Horstmeyer Rd
- 2396 Houghton Hollow Dr
- 5895 Horstmeyer Rd
- 5841 Horstmeyer Rd
- 5885 Horstmeyer Rd
- 2406 Houghton Hollow Dr
- 2388 Houghton Hollow Dr
- 2392 Houghton Hollow Dr
- 2403 Houghton Hollow Dr
- 5831 Horstmeyer Rd
- 5821 Horstmeyer Rd