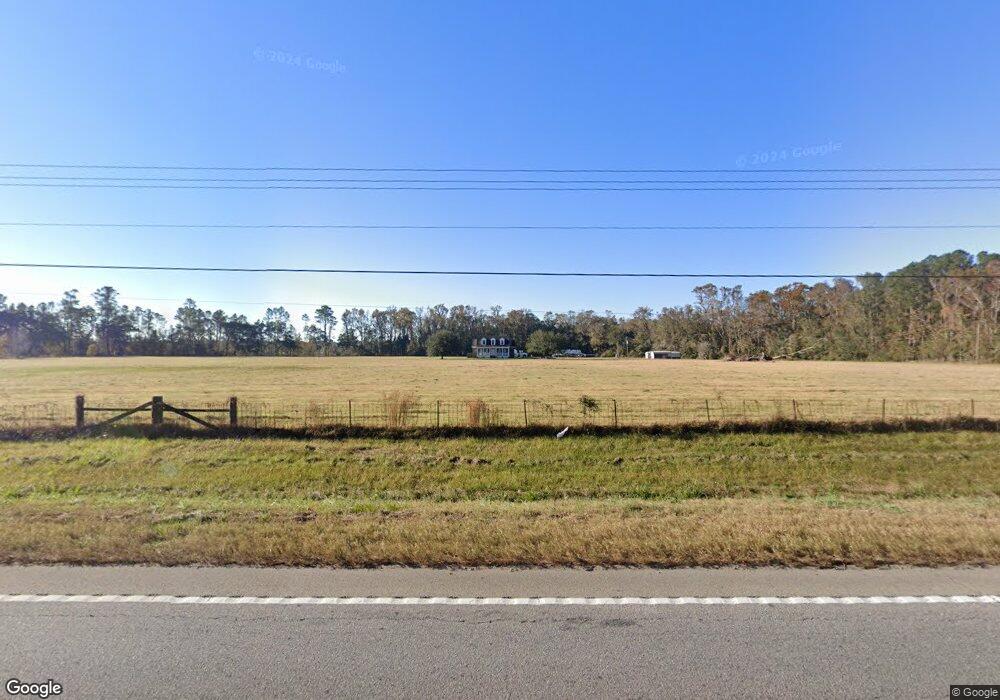
2388 U S 80 Bloomingdale, GA 31302
Estimated Value: $698,000 - $1,076,000
3
Beds
3
Baths
2,103
Sq Ft
$415/Sq Ft
Est. Value
About This Home
This home is located at 2388 U S 80, Bloomingdale, GA 31302 and is currently estimated at $872,618, approximately $414 per square foot. 2388 U S 80 is a home located in Effingham County with nearby schools including Marlow Elementary School, South Effingham Middle School, and South Effingham High School.
Ownership History
Date
Name
Owned For
Owner Type
Purchase Details
Closed on
Feb 22, 2024
Sold by
Baca Perez Miguel
Bought by
Baca Properties Llc
Current Estimated Value
Purchase Details
Closed on
Feb 15, 2024
Sold by
Perez Everardo Baca
Bought by
Baca Perez Miguel
Purchase Details
Closed on
Jul 18, 2022
Sold by
Baca Miguel
Bought by
Perez Everardo Baca
Purchase Details
Closed on
Jul 15, 2021
Sold by
Hatcher Brenda Renee
Bought by
Baca Miguel
Purchase Details
Closed on
Oct 8, 2020
Sold by
Hatcher Ashley Starling
Bought by
Hatcher Brenda Renee
Purchase Details
Closed on
May 12, 2014
Sold by
Hatcher Ashley S
Bought by
Hatcher Ashley S and Hatcher Brenda Renee
Purchase Details
Closed on
May 17, 2010
Sold by
Hatcher Ashley S
Bought by
Hatcher Ashley S and Hatcher Brenda Renee
Purchase Details
Closed on
Sep 23, 2005
Sold by
Hatcher Toledo S
Bought by
Hatcher Ashley S
Create a Home Valuation Report for This Property
The Home Valuation Report is an in-depth analysis detailing your home's value as well as a comparison with similar homes in the area
Home Values in the Area
Average Home Value in this Area
Purchase History
| Date | Buyer | Sale Price | Title Company |
|---|---|---|---|
| Baca Properties Llc | -- | -- | |
| Baca Perez Miguel | -- | -- | |
| Perez Everardo Baca | -- | -- | |
| Baca Miguel | $750,000 | -- | |
| Hatcher Brenda Renee | -- | -- | |
| Hatcher Ashley S | -- | -- | |
| Hatcher Ashley S | -- | -- | |
| Hatcher Ashley S | -- | -- |
Source: Public Records
Tax History Compared to Growth
Tax History
| Year | Tax Paid | Tax Assessment Tax Assessment Total Assessment is a certain percentage of the fair market value that is determined by local assessors to be the total taxable value of land and additions on the property. | Land | Improvement |
|---|---|---|---|---|
| 2024 | $6,592 | $221,790 | $135,918 | $85,872 |
| 2023 | $6,106 | $216,156 | $135,918 | $80,238 |
| 2022 | $4,379 | $141,021 | $60,783 | $80,238 |
| 2021 | $3,806 | $134,978 | $57,343 | $77,635 |
| 2020 | $2,539 | $128,824 | $56,218 | $72,606 |
| 2019 | $2,560 | $135,071 | $62,465 | $72,606 |
| 2018 | $2,385 | $105,826 | $38,752 | $67,074 |
| 2017 | $2,402 | $105,826 | $38,752 | $67,074 |
| 2016 | $2,203 | $102,664 | $38,752 | $63,912 |
| 2015 | -- | $102,664 | $38,752 | $63,912 |
| 2014 | -- | $81,731 | $17,819 | $63,912 |
| 2013 | -- | $81,731 | $17,818 | $63,912 |
Source: Public Records
Map
Nearby Homes
- 2565 Us Highway 80
- 2565 Us Highway 80
- 2060 Us Highway 80
- 278 Horseshoe Rd
- Tract 2 Williams St
- 195 Railroad St
- 225 Oconee Ave
- 184 Coneflower Rd
- 203 Coneflower Rd
- 202 Coneflower Rd
- 415 Salvia Rd
- 708 Chickadee St
- 148 Pine View Dr
- 0 Eight St Unit 326405
- 138 Bradford Dr
- 612 Ballastone Cir
- 227 Pebblestone Dr
- 223 Pebblestone Dr
- 100 Sandstone Dr
- 511 Cobblestone Cir
- 2388 Us Highway 80
- 2486 U S 80
- 2486 Us Highway 80
- 2431 Us Highway 80
- 2447 Us Highway 80
- 2473 Us Highway 80
- 139 George Rd
- 120 George Rd
- 2493 Us Highway 80
- 2278 Us Highway 80
- 2278 Us Highway 80 Unit 1
- 2300 Us Highway 80
- 2505 Us Highway 80
- 159 George Rd
- 2276 Us Highway 80
- 2519 Us Highway 80
- 162 George Rd
- 175 George Rd
- 180 George Rd
- 195 George Rd