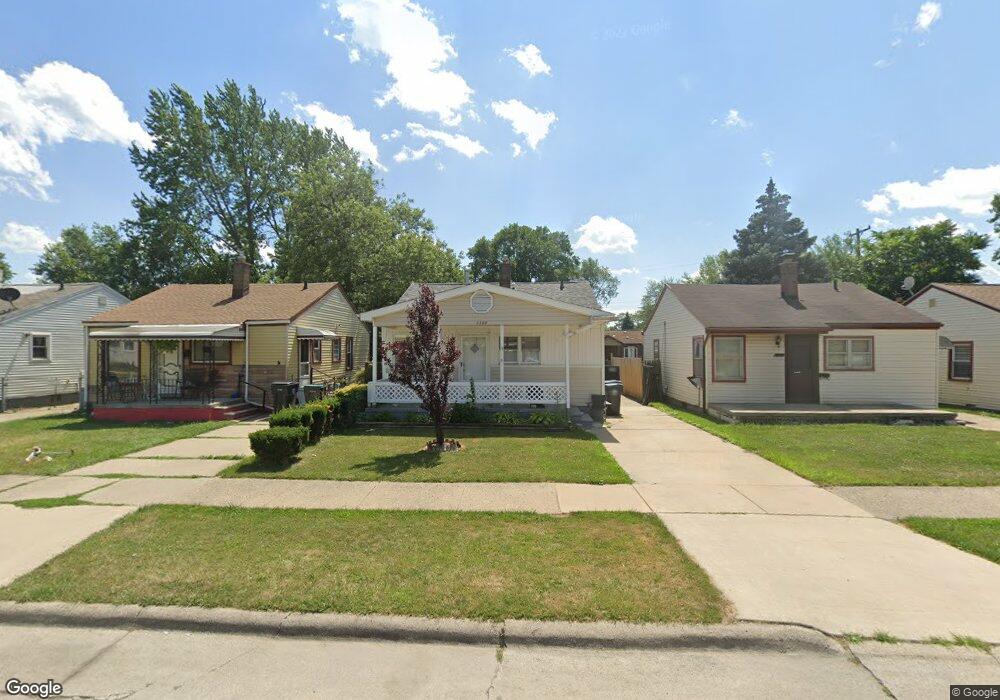
2389 Downing St Melvindale, MI 48122
Estimated Value: $93,000 - $122,549
--
Bed
--
Bath
1,080
Sq Ft
$104/Sq Ft
Est. Value
About This Home
This home is located at 2389 Downing St, Melvindale, MI 48122 and is currently estimated at $112,637, approximately $104 per square foot. 2389 Downing St is a home located in Wayne County with nearby schools including Rogers Early Elementary School, Allendale Elementary School, and Julian O. Strong Middle School.
Ownership History
Date
Name
Owned For
Owner Type
Purchase Details
Closed on
Mar 14, 2022
Sold by
Mohamed Munaser Abdo
Bought by
13200 Leonard Llc
Current Estimated Value
Purchase Details
Closed on
May 16, 2018
Sold by
Alsaidi Properties Llc
Bought by
Munaser Abdo Mohamed
Purchase Details
Closed on
Mar 26, 2018
Sold by
Wells Fargo Bank Na
Bought by
Alsaidi Properties Llc
Purchase Details
Closed on
May 6, 2017
Sold by
Sowders Vicke and Sowders Duane
Bought by
Cfd Solution Llc
Purchase Details
Closed on
May 4, 2017
Sold by
Sowders Vicki and Sowders Duane
Bought by
Well Fargo Bank Na
Purchase Details
Closed on
May 29, 1997
Sold by
Karen A and Lewi Richard C
Bought by
Amanda J and Stringer Jason R
Purchase Details
Closed on
Aug 23, 1994
Sold by
Callihan Kenneth
Bought by
Kenneth E J Callihan
Create a Home Valuation Report for This Property
The Home Valuation Report is an in-depth analysis detailing your home's value as well as a comparison with similar homes in the area
Home Values in the Area
Average Home Value in this Area
Purchase History
| Date | Buyer | Sale Price | Title Company |
|---|---|---|---|
| 13200 Leonard Llc | -- | None Listed On Document | |
| Munaser Abdo Mohamed | -- | None Available | |
| Alsaidi Properties Llc | $48,150 | None Available | |
| Cfd Solution Llc | $750 | None Available | |
| Well Fargo Bank Na | $28,500 | None Available | |
| Amanda J | $60,000 | -- | |
| Kenneth E J Callihan | $44,000 | -- |
Source: Public Records
Tax History Compared to Growth
Tax History
| Year | Tax Paid | Tax Assessment Tax Assessment Total Assessment is a certain percentage of the fair market value that is determined by local assessors to be the total taxable value of land and additions on the property. | Land | Improvement |
|---|---|---|---|---|
| 2025 | $1,433 | $49,400 | $0 | $0 |
| 2024 | $1,433 | $41,400 | $0 | $0 |
| 2023 | $1,363 | $39,600 | $0 | $0 |
| 2022 | $2,190 | $35,700 | $0 | $0 |
| 2021 | $2,122 | $30,900 | $0 | $0 |
| 2020 | $2,110 | $24,200 | $0 | $0 |
| 2019 | $1,979 | $22,800 | $0 | $0 |
| 2018 | $1,113 | $18,500 | $0 | $0 |
| 2017 | $928 | $19,000 | $0 | $0 |
| 2016 | $1,185 | $18,200 | $0 | $0 |
| 2015 | $1,720 | $17,200 | $0 | $0 |
| 2013 | $1,740 | $18,200 | $0 | $0 |
| 2012 | $1,305 | $17,800 | $2,500 | $15,300 |
Source: Public Records
Map
Nearby Homes
- 2527 Corbin St
- 2326 Fisher St
- 2809 Margaret St
- 2573 Grace St
- 2800 David St
- 19120 Dix Rd
- 17663 Clarann St
- 2790 Blanche St
- 18949 Wall St
- 19211 Wall St
- 12836 Conway St
- 17579 Park St
- 000 Harlow St
- 17150 Flora St
- 0002 Prospect St
- 0001 Prospect St
- 2601 S Fort St
- 3603 Harlow Ave
- 1862 Montie Rd
- 17951 Prospect St
- 2395 Downing St
- 2383 Downing St
- 2403 Downing St
- 2377 Downing St
- 2369 Downing St
- 2409 Downing St
- 2388 Corbin St
- 2380 Corbin St
- 2394 Corbin St
- 2363 Downing St
- 2408 Corbin St
- 2374 Corbin St
- 2366 Corbin St
- 2386 Downing St
- 2380 Downing St
- 2394 Downing St
- 2357 Downing St
- 2404 Downing St
- 2360 Corbin St
- 2374 Downing St