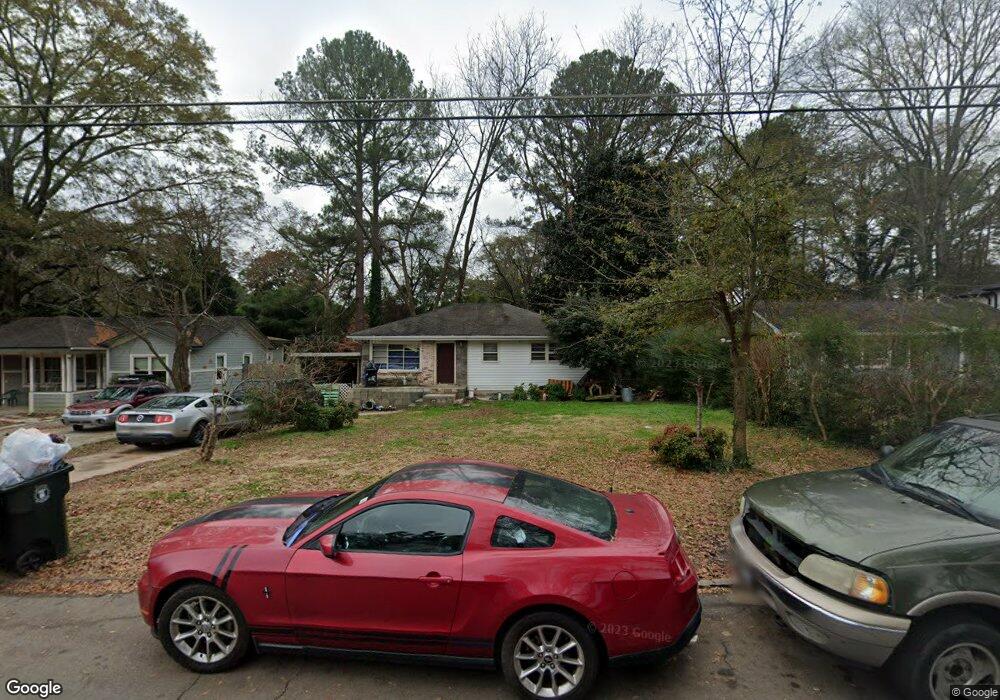
2389 Woodside Way Atlanta, GA 30341
Estimated Value: $246,000 - $315,000
2
Beds
1
Bath
936
Sq Ft
$298/Sq Ft
Est. Value
About This Home
This home is located at 2389 Woodside Way, Atlanta, GA 30341 and is currently estimated at $278,840, approximately $297 per square foot. 2389 Woodside Way is a home located in DeKalb County with nearby schools including Dresden Elementary School, Sequoyah Middle School, and Cross Keys High School.
Ownership History
Date
Name
Owned For
Owner Type
Purchase Details
Closed on
Dec 10, 2015
Sold by
Caf B L 2015 Llc
Bought by
Ct Amm B 2 Llc
Current Estimated Value
Purchase Details
Closed on
Sep 19, 2014
Sold by
Peachtree Street Real Estate I
Bought by
Prager Bridge Property I Inc
Purchase Details
Closed on
Dec 31, 2013
Sold by
Great Investors Grp Llc
Bought by
Peachtree Street Real Estate I
Purchase Details
Closed on
Dec 30, 2013
Sold by
Merchant Arif
Bought by
Great Investors Grp Llc
Purchase Details
Closed on
Mar 9, 2010
Sold by
Federal Natl Mtg Assn Fnma
Bought by
Merchant Arif
Purchase Details
Closed on
Jul 7, 2009
Sold by
Citimortgage Inc
Bought by
Federal National Mortgage Association
Purchase Details
Closed on
May 26, 1995
Sold by
Hall Dorothy E
Bought by
Bradley Michael D
Create a Home Valuation Report for This Property
The Home Valuation Report is an in-depth analysis detailing your home's value as well as a comparison with similar homes in the area
Home Values in the Area
Average Home Value in this Area
Purchase History
| Date | Buyer | Sale Price | Title Company |
|---|---|---|---|
| Ct Amm B 2 Llc | -- | -- | |
| Prager Bridge Property I Inc | $83,263 | -- | |
| Peachtree Street Real Estate I | $57,955 | -- | |
| Great Investors Grp Llc | -- | -- | |
| Merchant Arif | $55,200 | -- | |
| Federal National Mortgage Association | -- | -- | |
| Citimortgage Inc | $78,143 | -- | |
| Bradley Michael D | $78,000 | -- |
Source: Public Records
Mortgage History
| Date | Status | Borrower | Loan Amount |
|---|---|---|---|
| Closed | Bradley Michael D | $0 |
Source: Public Records
Tax History Compared to Growth
Tax History
| Year | Tax Paid | Tax Assessment Tax Assessment Total Assessment is a certain percentage of the fair market value that is determined by local assessors to be the total taxable value of land and additions on the property. | Land | Improvement |
|---|---|---|---|---|
| 2025 | $5,618 | $117,920 | $26,000 | $91,920 |
| 2024 | $4,037 | $85,480 | $26,000 | $59,480 |
| 2023 | $4,037 | $85,480 | $26,000 | $59,480 |
| 2022 | $3,643 | $89,680 | $26,000 | $63,680 |
| 2021 | $3,760 | $81,440 | $26,000 | $55,440 |
| 2020 | $3,300 | $69,360 | $26,000 | $43,360 |
| 2019 | $3,351 | $70,720 | $26,000 | $44,720 |
| 2018 | $1,852 | $53,480 | $12,640 | $40,840 |
| 2017 | $1,716 | $22,560 | $12,600 | $9,960 |
| 2016 | $1,271 | $22,560 | $12,600 | $9,960 |
| 2014 | $1,321 | $22,640 | $12,600 | $10,040 |
Source: Public Records
Map
Nearby Homes
- 2899 Shallowford Rd NE
- 2364 Woodside Way
- 2942 Arrow Creek Dr
- 2363 Woodside Way
- 2844 Whispering Hills Dr
- 2762 Dresden Dr NE
- 2910 Marlin Dr
- 2608 Woodgreen Dr
- 2920 Appling Dr
- 2710 Dresden Dr
- 2710 Dresden Dr
- 3188 Shallowford Rd NE
- 3071 Colonial Way Unit K
- 3071 Colonial Way Unit J
- 3125 Colonial Way Unit D
- 3079 Colonial Way Unit J
- 3087 Colonial Way Unit J
- 3083 Colonial Way
- 3078 Meadow Mere W Unit 3078
- 2383 Woodside Way
- 2395 Woodside Way
- 2399 Woodside Way
- 2377 Woodside Way
- 2404 Arrow Cir
- 2410 Arrow Cir
- 2388 Woodside Way
- 2405 Woodside Way
- 2396 Woodside Way
- 2373 Woodside Way
- 0 Woodside Way Unit 8569633
- 0 Woodside Way Unit 8015861
- 0 Woodside Way Unit 7097702
- 0 Woodside Way Unit 9001336
- 0 Woodside Way
- 2416 Arrow Cir Unit 2
- 2947 Hilltop Dr
- 2398 Arrow Cir
- 2367 Woodside Way
- 2953 Hilltop Dr