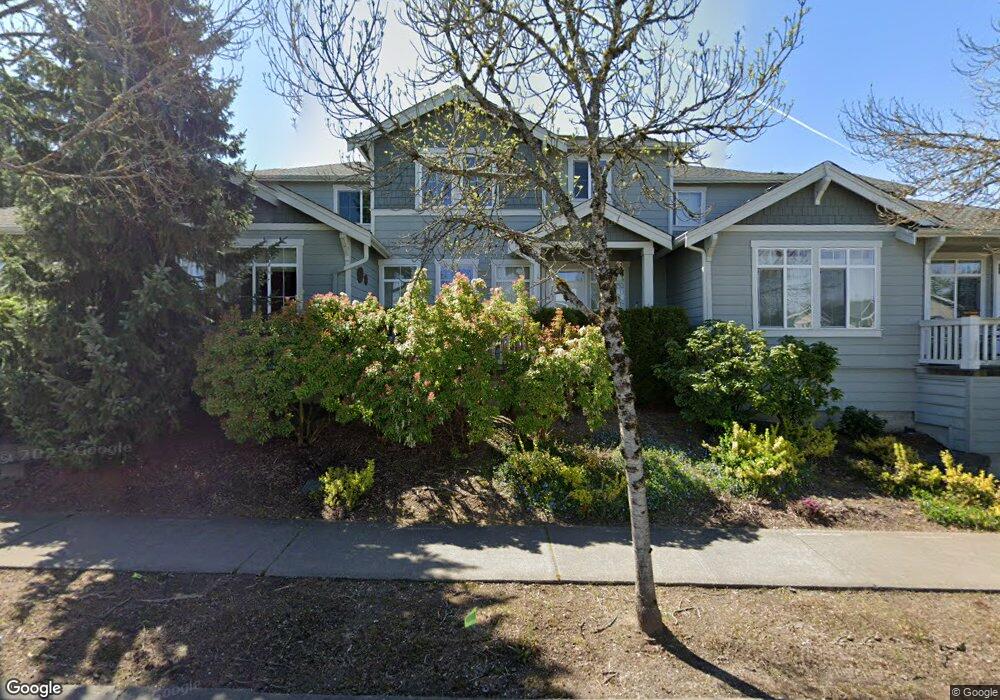
23897 NE 112th Cir Redmond, WA 98053
Union Hill-Novelty Hill NeighborhoodEstimated Value: $674,000 - $896,000
3
Beds
3
Baths
1,539
Sq Ft
$520/Sq Ft
Est. Value
About This Home
This home is located at 23897 NE 112th Cir, Redmond, WA 98053 and is currently estimated at $800,047, approximately $519 per square foot. 23897 NE 112th Cir is a home located in King County with nearby schools including Ella Baker Elementary School, Timberline Middle School, and Redmond High School.
Ownership History
Date
Name
Owned For
Owner Type
Purchase Details
Closed on
Jul 17, 2019
Sold by
Payne Jeanetta Lynn
Bought by
Sison Chavez Carmelita and Carandang Chavez Isabelo
Current Estimated Value
Home Financials for this Owner
Home Financials are based on the most recent Mortgage that was taken out on this home.
Original Mortgage
$426,000
Outstanding Balance
$373,214
Interest Rate
3.82%
Mortgage Type
New Conventional
Estimated Equity
$426,833
Purchase Details
Closed on
Aug 5, 2013
Sold by
Luu Vicky
Bought by
Payne Jeanetta Lynn
Purchase Details
Closed on
Dec 1, 2009
Sold by
Luu Vicky Kim and Luong Phuoc
Bought by
Luu Vicky Kim
Purchase Details
Closed on
Sep 13, 2006
Sold by
Sshi Llc
Bought by
Luu Vicky Kim and Luong Phuoc
Home Financials for this Owner
Home Financials are based on the most recent Mortgage that was taken out on this home.
Original Mortgage
$266,360
Interest Rate
6.56%
Mortgage Type
New Conventional
Create a Home Valuation Report for This Property
The Home Valuation Report is an in-depth analysis detailing your home's value as well as a comparison with similar homes in the area
Home Values in the Area
Average Home Value in this Area
Purchase History
| Date | Buyer | Sale Price | Title Company |
|---|---|---|---|
| Sison Chavez Carmelita | $532,500 | Wfg Natl Ttl Co Of Wa Llc | |
| Payne Jeanetta Lynn | $275,000 | Chicago Title | |
| Luu Vicky Kim | -- | None Available | |
| Luu Vicky Kim | $333,800 | Chicago Title |
Source: Public Records
Mortgage History
| Date | Status | Borrower | Loan Amount |
|---|---|---|---|
| Open | Sison Chavez Carmelita | $426,000 | |
| Previous Owner | Luu Vicky Kim | $266,360 |
Source: Public Records
Tax History Compared to Growth
Tax History
| Year | Tax Paid | Tax Assessment Tax Assessment Total Assessment is a certain percentage of the fair market value that is determined by local assessors to be the total taxable value of land and additions on the property. | Land | Improvement |
|---|---|---|---|---|
| 2024 | $6,803 | $711,000 | $77,100 | $633,900 |
| 2023 | $6,012 | $725,000 | $77,100 | $647,900 |
| 2022 | $5,903 | $671,000 | $68,500 | $602,500 |
| 2021 | $5,857 | $564,000 | $68,500 | $495,500 |
| 2020 | $5,490 | $510,000 | $60,000 | $450,000 |
| 2018 | $4,634 | $334,000 | $55,700 | $278,300 |
| 2017 | $4,214 | $375,000 | $55,700 | $319,300 |
| 2016 | $3,754 | $349,000 | $60,000 | $289,000 |
| 2015 | $3,479 | $305,000 | $60,000 | $245,000 |
| 2014 | -- | $274,000 | $60,000 | $214,000 |
| 2013 | -- | $304,000 | $60,000 | $244,000 |
Source: Public Records
Map
Nearby Homes
- 23884 NE 112th Cir Unit 2
- 23910 NE 112th Place Unit 1
- 23905 NE 113th Ln Unit 4
- 24120 NE 112th Ln Unit 113
- 24129 NE 112th Ln Unit 151
- 23925 NE 115th Ln Unit 304
- 23916 NE 115th Ln Unit 204
- 11008 243rd Ave NE
- 11037 236th Place NE
- 10909 243rd Ave NE
- 10842 243rd Ave NE
- 10449 Sheridan Crescent NE
- 24589 NE 118th Place
- 24036 NE Adair Rd
- 10427 248th Ave NE
- 12427 243rd Terrace NE
- 12438 243rd Place NE
- 12441 Adair Creek Way NE
- 12415 235th Place NE
- 23806 NE 126th Place
- 23897 NE 112th Cir Unit 2
- 23897 NE 112th Cir Unit 1
- 1123 241st Ln NE
- 23892 NE 112th Cir
- 23892 NE 112th Cir Unit 1
- 23892 NE 112th Cir Unit 2
- 23869 NE 112th Cir Unit 2
- 23881 NE 112th Cir Unit 1
- 23881 NE 112th Cir Unit 2
- 23881 NE 112th Cir Unit 3
- 23889 NE 112th Cir
- 23909 NE 112th Place Unit 134
- 23909 NE 112th Place
- 23911 NE 112th Place
- 23873 NE 112th Cir Unit 1
- 23902 NE 112th Ln Unit 114
- 23902 NE 112th Ln
- 23908 NE 112th Place
- 23856 NE 112th Cir Unit 1
- 23860-3 NE 112th Cir