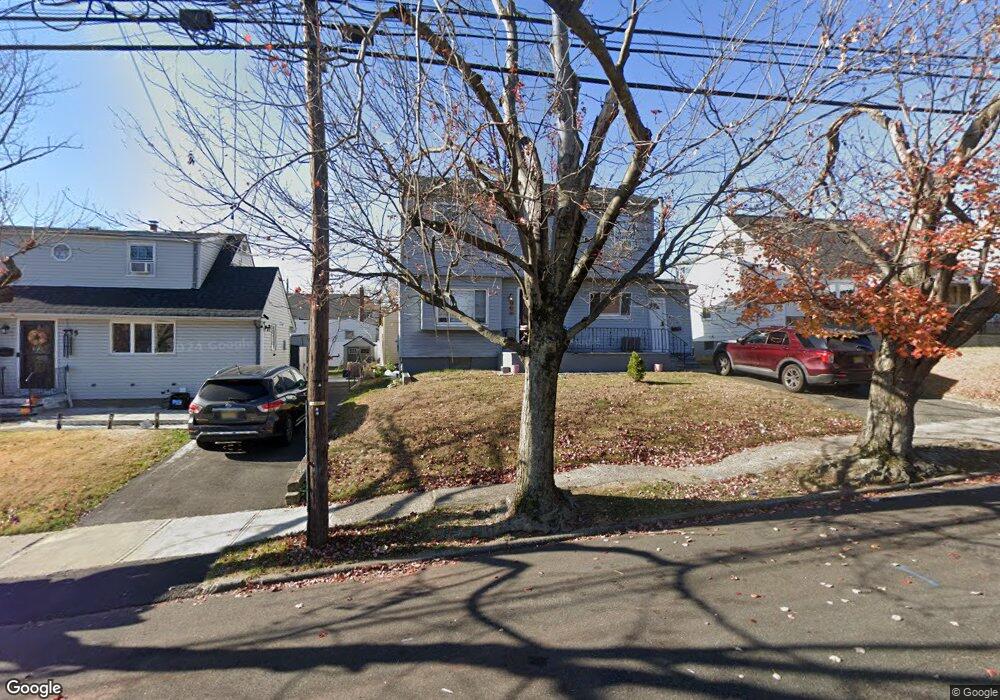
239-241 Richmond Ave Paterson, NJ 07502
Hillcrest NeighborhoodEstimated Value: $537,000 - $600,000
4
Beds
3
Baths
1,578
Sq Ft
$355/Sq Ft
Est. Value
About This Home
This home is located at 239-241 Richmond Ave, Paterson, NJ 07502 and is currently estimated at $560,477, approximately $355 per square foot. 239-241 Richmond Ave is a home located in Passaic County with nearby schools including Edward W. Kilpatrick School of Discovery, Dale Avenue Elementary School, and Paterson Public School No. 5.
Ownership History
Date
Name
Owned For
Owner Type
Purchase Details
Closed on
Jan 6, 2023
Sold by
Ellington Evert and Ellington Cynthia
Bought by
Ali Mohammed K
Current Estimated Value
Home Financials for this Owner
Home Financials are based on the most recent Mortgage that was taken out on this home.
Original Mortgage
$405,000
Outstanding Balance
$392,199
Interest Rate
6.48%
Mortgage Type
New Conventional
Estimated Equity
$168,278
Purchase Details
Closed on
Jun 22, 2017
Sold by
Miller Mckinney Teshia L and Mckinney Terence L
Bought by
Ellington Evert and Russell Ellington Cynthia
Home Financials for this Owner
Home Financials are based on the most recent Mortgage that was taken out on this home.
Original Mortgage
$245,471
Interest Rate
6.6%
Mortgage Type
FHA
Purchase Details
Closed on
Feb 16, 1996
Sold by
Lawler Dennis and Lawler Lorita
Bought by
Mckinney Terence and Miller Teshia
Create a Home Valuation Report for This Property
The Home Valuation Report is an in-depth analysis detailing your home's value as well as a comparison with similar homes in the area
Home Values in the Area
Average Home Value in this Area
Purchase History
| Date | Buyer | Sale Price | Title Company |
|---|---|---|---|
| Ali Mohammed K | $450,000 | -- | |
| Ellington Evert | $250,000 | Main Street Title & Settleme | |
| Mckinney Terence | $133,500 | -- |
Source: Public Records
Mortgage History
| Date | Status | Borrower | Loan Amount |
|---|---|---|---|
| Open | Ali Mohammed K | $405,000 | |
| Previous Owner | Ellington Evert | $245,471 |
Source: Public Records
Tax History Compared to Growth
Tax History
| Year | Tax Paid | Tax Assessment Tax Assessment Total Assessment is a certain percentage of the fair market value that is determined by local assessors to be the total taxable value of land and additions on the property. | Land | Improvement |
|---|---|---|---|---|
| 2025 | $10,710 | $210,200 | $75,400 | $134,800 |
| 2024 | $10,306 | $210,200 | $75,400 | $134,800 |
| 2022 | $9,757 | $210,200 | $75,400 | $134,800 |
| 2021 | $9,409 | $210,200 | $75,400 | $134,800 |
| 2020 | $8,776 | $210,200 | $75,400 | $134,800 |
| 2019 | $8,495 | $205,500 | $73,800 | $131,700 |
| 2018 | $8,769 | $202,700 | $73,100 | $129,600 |
| 2017 | $7,837 | $188,400 | $72,700 | $115,700 |
| 2016 | $8,626 | $198,800 | $76,500 | $122,300 |
| 2015 | $8,167 | $198,800 | $76,500 | $122,300 |
| 2014 | $7,642 | $263,500 | $158,800 | $104,700 |
Source: Public Records
Map
Nearby Homes
- 231 Lenox Ave Unit 233
- 231-233 Lenox Ave
- 239 Lexington Ave Unit 241
- 295-297 Linwood Ave
- 91 Chatham Ave
- 89-91 Chatham Ave
- 237 Sherwood Ave Unit 239
- 207 Burlington Ave
- 203-207 Burlington Ave
- 41 Stirling Terrace
- 153 Arlington Ave Unit 155
- 153 155arlington Ave
- 256-258 Elberon Ave
- 256 Elberon Ave Unit 258
- 512 Preakness Ave
- 262-280 Chamberlain Ave Unit 4
- 119 Burlington Ave Unit 121
- 119-121 Burlington Ave
- 120 Sherwood Ave Unit 102
- 481 Preakness Ave
- 239 Richmond Ave Unit 241
- 235 Richmond Ave Unit 237
- 235-237 Richmond Ave
- 243 Richmond Ave Unit 245
- 247 Richmond Ave Unit 249
- 231 Richmond Ave Unit 233
- 240 Lenox Ave Unit 242
- 244 Lenox Ave Unit 246
- 236 Lenox Ave Unit 238
- 251 Richmond Ave Unit 253
- 227 Richmond Ave Unit 229
- 248 Lenox Ave Unit 250
- 232 Lenox Ave Unit 234
- 252 Lenox Ave Unit 254
- 228 Lenox Ave Unit 230
- 255 Richmond Ave Unit 257
- 223 Richmond Ave Unit 225
- 224 Lenox Ave Unit 226
- 256 Lenox Ave Unit 258
- 224-226 Richmond Ave