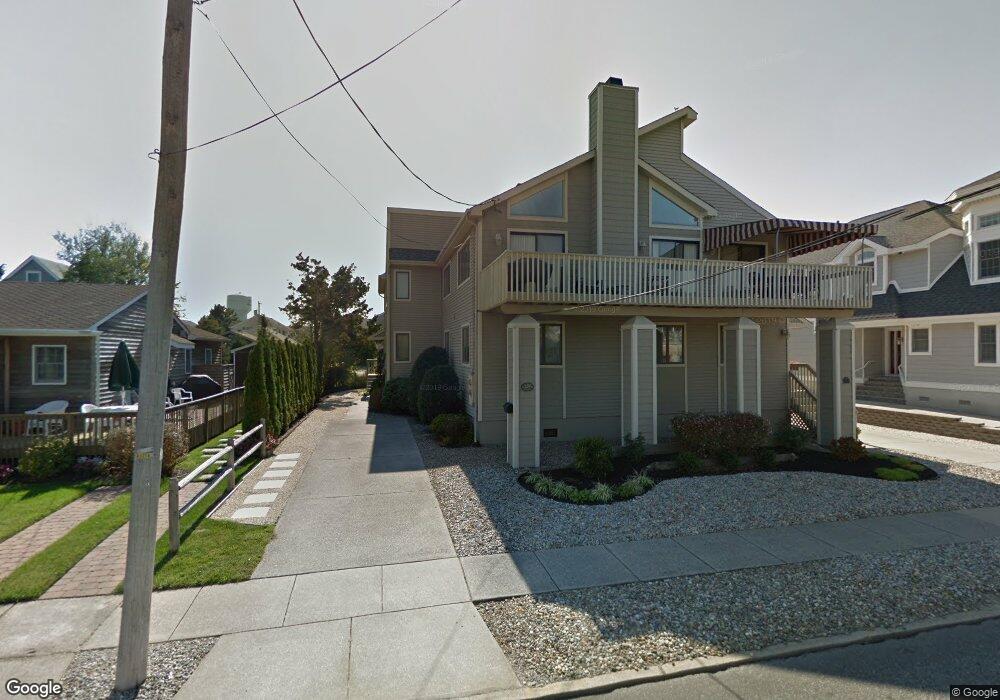
239 91st St Stone Harbor, NJ 08247
Estimated Value: $1,614,000 - $2,524,000
--
Bed
--
Bath
2,016
Sq Ft
$979/Sq Ft
Est. Value
About This Home
This home is located at 239 91st St, Stone Harbor, NJ 08247 and is currently estimated at $1,973,631, approximately $978 per square foot. 239 91st St is a home located in Cape May County with nearby schools including Stone Harbor Elementary School.
Ownership History
Date
Name
Owned For
Owner Type
Purchase Details
Closed on
Apr 27, 1999
Sold by
Healy Karen
Bought by
Smoll Ronald and Smoll Carol
Current Estimated Value
Home Financials for this Owner
Home Financials are based on the most recent Mortgage that was taken out on this home.
Original Mortgage
$115,000
Outstanding Balance
$29,492
Interest Rate
6.95%
Estimated Equity
$1,944,139
Purchase Details
Closed on
May 6, 1991
Sold by
Healy Iii John E and Healy Karen
Bought by
Healy Karen F
Create a Home Valuation Report for This Property
The Home Valuation Report is an in-depth analysis detailing your home's value as well as a comparison with similar homes in the area
Home Values in the Area
Average Home Value in this Area
Purchase History
| Date | Buyer | Sale Price | Title Company |
|---|---|---|---|
| Smoll Ronald | $413,000 | -- | |
| Healy Karen F | -- | -- |
Source: Public Records
Mortgage History
| Date | Status | Borrower | Loan Amount |
|---|---|---|---|
| Open | Smoll Ronald | $115,000 |
Source: Public Records
Tax History Compared to Growth
Tax History
| Year | Tax Paid | Tax Assessment Tax Assessment Total Assessment is a certain percentage of the fair market value that is determined by local assessors to be the total taxable value of land and additions on the property. | Land | Improvement |
|---|---|---|---|---|
| 2025 | $7,300 | $976,000 | $792,500 | $183,500 |
| 2024 | $7,300 | $976,000 | $792,500 | $183,500 |
| 2023 | $7,174 | $976,000 | $792,500 | $183,500 |
| 2022 | $6,754 | $976,000 | $792,500 | $183,500 |
| 2021 | $4,690 | $976,000 | $792,500 | $183,500 |
| 2020 | $5,954 | $976,000 | $792,500 | $183,500 |
| 2019 | $5,592 | $976,000 | $792,500 | $183,500 |
| 2018 | $5,590 | $1,012,700 | $792,500 | $220,200 |
| 2017 | $4,959 | $893,500 | $686,800 | $206,700 |
| 2016 | $4,780 | $893,500 | $686,800 | $206,700 |
| 2015 | $4,691 | $893,500 | $686,800 | $206,700 |
| 2014 | $4,628 | $893,500 | $686,800 | $206,700 |
Source: Public Records
Map
Nearby Homes