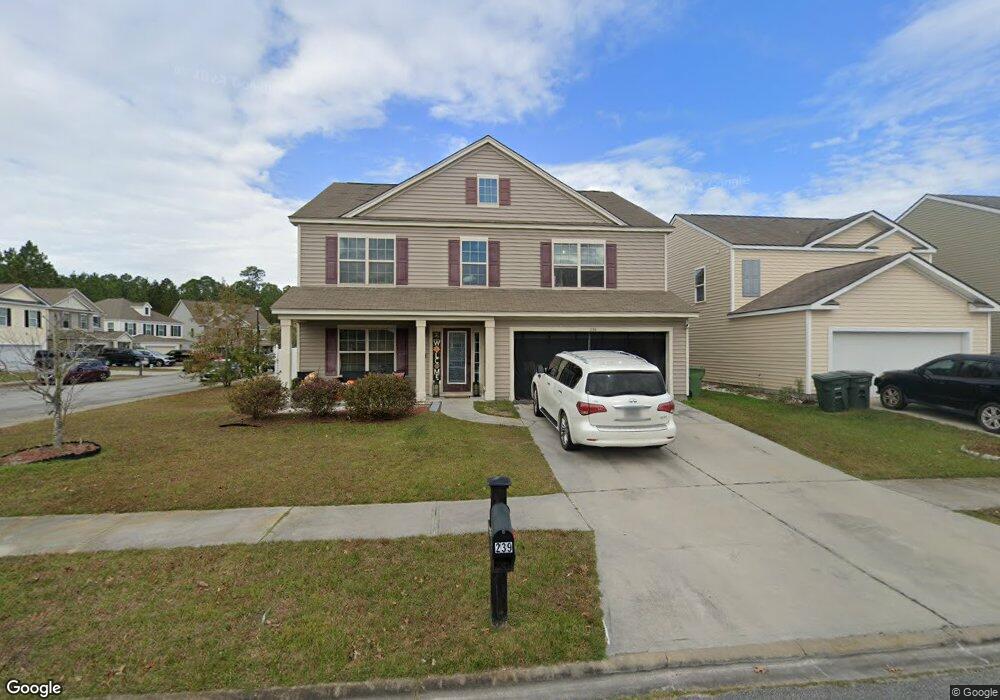
239 Bender St Hinesville, GA 31313
Estimated Value: $305,000 - $344,000
5
Beds
4
Baths
2,850
Sq Ft
$115/Sq Ft
Est. Value
About This Home
This home is located at 239 Bender St, Hinesville, GA 31313 and is currently estimated at $328,290, approximately $115 per square foot. 239 Bender St is a home located in Liberty County with nearby schools including Waldo Pafford Elementary School, Lewis Frasier Middle School, and Bradwell Institute.
Ownership History
Date
Name
Owned For
Owner Type
Purchase Details
Closed on
Dec 11, 2013
Sold by
D R Horton Inc
Bought by
Crimel Terrence and Crimel Tabritha D
Current Estimated Value
Home Financials for this Owner
Home Financials are based on the most recent Mortgage that was taken out on this home.
Original Mortgage
$219,622
Outstanding Balance
$165,247
Interest Rate
4.38%
Mortgage Type
VA
Estimated Equity
$163,043
Purchase Details
Closed on
Jan 14, 2013
Sold by
Quinnco Marne Llc
Bought by
D R Horton Inc
Create a Home Valuation Report for This Property
The Home Valuation Report is an in-depth analysis detailing your home's value as well as a comparison with similar homes in the area
Home Values in the Area
Average Home Value in this Area
Purchase History
| Date | Buyer | Sale Price | Title Company |
|---|---|---|---|
| Crimel Terrence | $215,000 | -- | |
| D R Horton Inc | $742,000 | -- |
Source: Public Records
Mortgage History
| Date | Status | Borrower | Loan Amount |
|---|---|---|---|
| Open | Crimel Terrence | $219,622 |
Source: Public Records
Tax History Compared to Growth
Tax History
| Year | Tax Paid | Tax Assessment Tax Assessment Total Assessment is a certain percentage of the fair market value that is determined by local assessors to be the total taxable value of land and additions on the property. | Land | Improvement |
|---|---|---|---|---|
| 2024 | $6,546 | $133,638 | $18,000 | $115,638 |
| 2023 | $6,546 | $118,155 | $16,000 | $102,155 |
| 2022 | $4,670 | $100,625 | $14,400 | $86,225 |
| 2021 | $4,317 | $91,297 | $14,400 | $76,897 |
| 2020 | $3,948 | $82,665 | $12,000 | $70,665 |
| 2019 | $3,952 | $83,391 | $12,000 | $71,391 |
| 2018 | $3,954 | $83,887 | $12,000 | $71,887 |
| 2017 | $2,786 | $84,613 | $12,000 | $72,613 |
| 2016 | $3,799 | $84,613 | $12,000 | $72,613 |
| 2015 | $3,903 | $84,613 | $12,000 | $72,613 |
| 2014 | $3,903 | $88,257 | $12,000 | $76,257 |
| 2013 | -- | $12,000 | $12,000 | $0 |
Source: Public Records
Map
Nearby Homes
- 234 Bender St
- 137 Davila St
- Lt 10/11 Davila St
- LT 12/13 Davila St
- 73 Gambrell Rd
- 47 Gambrell Rd
- 233 Rutledge Dr
- 223 Rutledge Dr
- 504 Rutledge Dr
- 20 Anzio Ave
- 571 Rutledge Dr
- 27 Anzio Ave
- 177 Courage Way
- 8.67 AC W 15th St
- 35+ Acre Wells Rd
- 56.16 AC W 15th St
- 180 Juniper Dr
- 170 Juniper Dr
- 158 Juniper Dr
- 144 Juniper Dr