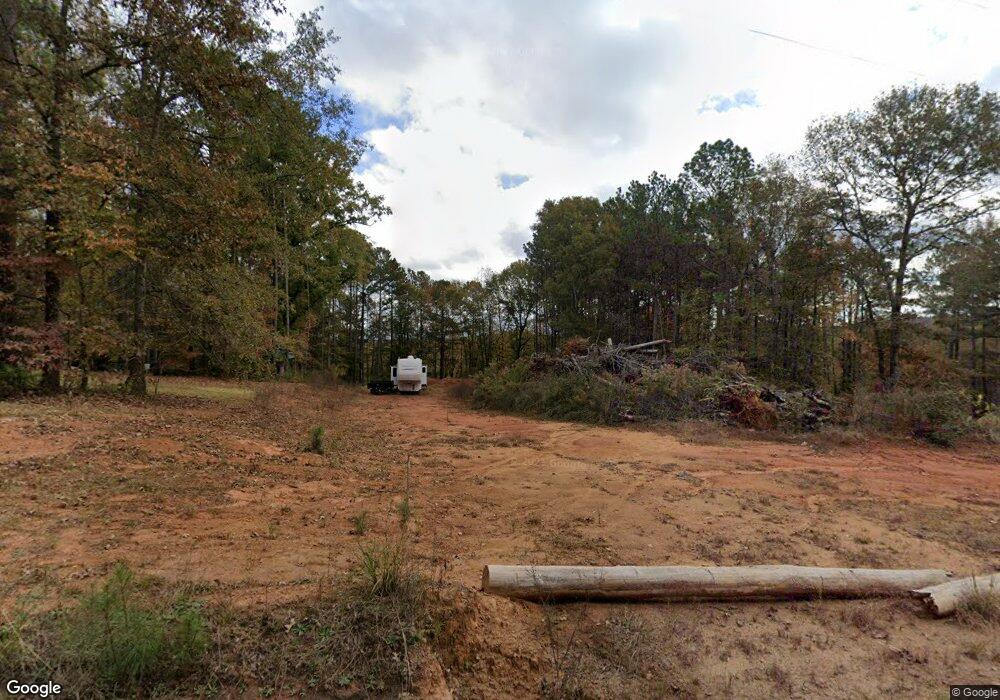
239 Bottoms Rd Barnesville, GA 30204
Estimated Value: $170,283 - $255,000
3
Beds
2
Baths
984
Sq Ft
$205/Sq Ft
Est. Value
About This Home
This home is located at 239 Bottoms Rd, Barnesville, GA 30204 and is currently estimated at $202,071, approximately $205 per square foot. 239 Bottoms Rd is a home located in Lamar County with nearby schools including Lamar County Primary School, Lamar County Elementary School, and Lamar County Middle School.
Ownership History
Date
Name
Owned For
Owner Type
Purchase Details
Closed on
Mar 15, 2022
Sold by
Colado Ken
Bought by
Stallings William Tyrell
Current Estimated Value
Home Financials for this Owner
Home Financials are based on the most recent Mortgage that was taken out on this home.
Original Mortgage
$83,874
Outstanding Balance
$78,032
Interest Rate
3.55%
Mortgage Type
New Conventional
Estimated Equity
$124,040
Purchase Details
Closed on
Dec 20, 2006
Sold by
Colado Ken
Bought by
Colado Kenneth
Home Financials for this Owner
Home Financials are based on the most recent Mortgage that was taken out on this home.
Original Mortgage
$45,600
Interest Rate
6.1%
Mortgage Type
New Conventional
Purchase Details
Closed on
Oct 17, 2006
Sold by
Not Provided
Bought by
Colado Ken and Wilson Sherry D
Home Financials for this Owner
Home Financials are based on the most recent Mortgage that was taken out on this home.
Original Mortgage
$30,745
Interest Rate
6.36%
Mortgage Type
New Conventional
Purchase Details
Closed on
Jul 10, 2006
Sold by
Not Provided
Bought by
Colado Ken and Wilson Sherry D
Purchase Details
Closed on
Oct 18, 2002
Sold by
Hubbard Randall
Bought by
Hubbard Randy
Create a Home Valuation Report for This Property
The Home Valuation Report is an in-depth analysis detailing your home's value as well as a comparison with similar homes in the area
Home Values in the Area
Average Home Value in this Area
Purchase History
| Date | Buyer | Sale Price | Title Company |
|---|---|---|---|
| Stallings William Tyrell | $92,900 | -- | |
| Colado Kenneth | -- | -- | |
| Colado Ken | $41,000 | -- | |
| Colado Ken | $57,357 | -- | |
| Hubbard Randy | -- | -- |
Source: Public Records
Mortgage History
| Date | Status | Borrower | Loan Amount |
|---|---|---|---|
| Open | Stallings William Tyrell | $83,874 | |
| Previous Owner | Colado Kenneth | $45,600 | |
| Previous Owner | Colado Ken | $30,745 |
Source: Public Records
Tax History Compared to Growth
Tax History
| Year | Tax Paid | Tax Assessment Tax Assessment Total Assessment is a certain percentage of the fair market value that is determined by local assessors to be the total taxable value of land and additions on the property. | Land | Improvement |
|---|---|---|---|---|
| 2024 | $1,303 | $50,911 | $9,524 | $41,387 |
| 2023 | $1,026 | $50,001 | $9,524 | $40,477 |
| 2022 | $1,208 | $43,775 | $6,039 | $37,736 |
| 2021 | $1,006 | $33,452 | $4,260 | $29,192 |
| 2020 | $667 | $21,056 | $4,260 | $16,796 |
| 2019 | $668 | $21,056 | $4,260 | $16,796 |
| 2018 | $642 | $21,056 | $4,260 | $16,796 |
| 2017 | $638 | $21,056 | $4,260 | $16,796 |
| 2016 | $638 | $21,056 | $4,260 | $16,796 |
| 2015 | $638 | $21,056 | $4,260 | $16,796 |
| 2014 | $618 | $21,056 | $4,260 | $16,796 |
| 2013 | -- | $21,268 | $4,472 | $16,796 |
Source: Public Records
Map
Nearby Homes
- 216 Howard Rd
- 379 City Pond Rd
- 0 Eady Creek Rd Unit 10605408
- 277 Cole Forest Blvd
- 218 City Pond Rd
- V L Silver Dollar Rd
- 0 Veterans Unit 10508534
- 0 Veterans Unit 10429448
- 0 Silver Dollar Rd Unit 10552561
- 115 Silver Dollar Rd
- 309 Brinkley Rd
- 250 Mill St
- 0 Brinkley Rd Unit 10540131
- 101 3rd St
- 128 College Dr
- 0 Main St Unit 10586668
- 0 Main St Unit 10585681
- 0 Mill St Unit 10420113
- 0 Roberts Rd Unit 10593586
- 107 1st St
- 239 Bottoms Rd
- 239 Bottoms Rd
- 239 Bottoms Rd
- 239 Bottoms Rd
- 253 Bottoms Rd
- 221 Bottoms Rd
- 213 Bottoms Rd
- 4 Acres Bottoms Rd
- 190 Bottoms Rd
- 191 Bottoms Rd
- 731 Highway 36 E
- 189 Bottoms Rd
- 310 Bottoms Rd
- 765 Highway 36 E
- 765 Highway 36 E
- 350 Bottoms Rd
- 697 Highway 36 E
- 680 Highway 36 E
- 646 Highway 36 E
- 754 Highway 36 W