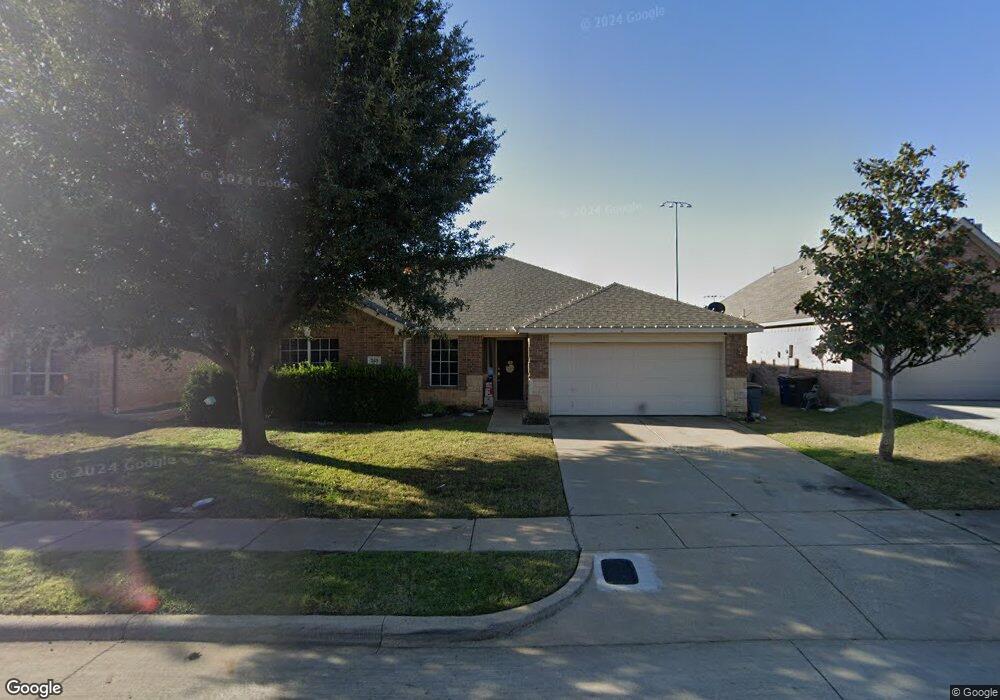
239 Cedar Crest Dr Justin, TX 76247
Estimated Value: $312,000 - $374,000
4
Beds
2
Baths
1,976
Sq Ft
$173/Sq Ft
Est. Value
About This Home
This home is located at 239 Cedar Crest Dr, Justin, TX 76247 and is currently estimated at $341,011, approximately $172 per square foot. 239 Cedar Crest Dr is a home located in Denton County with nearby schools including Justin Elementary School, Gene Pike Middle School, and Northwest High School.
Ownership History
Date
Name
Owned For
Owner Type
Purchase Details
Closed on
Feb 27, 2014
Sold by
Davis Ryan G and Davis Amy E
Bought by
Moore Tye P and Moore Melynda
Current Estimated Value
Home Financials for this Owner
Home Financials are based on the most recent Mortgage that was taken out on this home.
Original Mortgage
$153,061
Outstanding Balance
$116,585
Interest Rate
4.47%
Mortgage Type
New Conventional
Estimated Equity
$224,426
Purchase Details
Closed on
Nov 21, 2005
Sold by
Sheridan Homes
Bought by
Davis Ryan G and Davis Amy E
Home Financials for this Owner
Home Financials are based on the most recent Mortgage that was taken out on this home.
Original Mortgage
$114,792
Interest Rate
7.7%
Mortgage Type
Fannie Mae Freddie Mac
Purchase Details
Closed on
Aug 10, 2005
Sold by
Maa Har Residential Inc
Bought by
Sheridan Homes Meadow Vista Estates Lp
Create a Home Valuation Report for This Property
The Home Valuation Report is an in-depth analysis detailing your home's value as well as a comparison with similar homes in the area
Home Values in the Area
Average Home Value in this Area
Purchase History
| Date | Buyer | Sale Price | Title Company |
|---|---|---|---|
| Moore Tye P | -- | Alamo Title Company | |
| Davis Ryan G | -- | -- | |
| Sheridan Homes Meadow Vista Estates Lp | -- | Ctic |
Source: Public Records
Mortgage History
| Date | Status | Borrower | Loan Amount |
|---|---|---|---|
| Open | Moore Tye P | $153,061 | |
| Previous Owner | Davis Ryan G | $114,792 | |
| Closed | Davis Ryan G | $28,698 |
Source: Public Records
Tax History Compared to Growth
Tax History
| Year | Tax Paid | Tax Assessment Tax Assessment Total Assessment is a certain percentage of the fair market value that is determined by local assessors to be the total taxable value of land and additions on the property. | Land | Improvement |
|---|---|---|---|---|
| 2025 | $4,563 | $288,172 | $83,475 | $204,697 |
| 2024 | $5,690 | $298,560 | $0 | $0 |
| 2023 | $4,055 | $270,179 | $79,278 | $217,722 |
| 2022 | $5,214 | $245,617 | $63,000 | $205,931 |
| 2021 | $5,228 | $223,288 | $48,825 | $174,463 |
| 2020 | $4,820 | $210,000 | $48,825 | $161,175 |
| 2019 | $4,849 | $205,000 | $48,825 | $156,175 |
| 2018 | $4,580 | $192,624 | $48,825 | $146,175 |
| 2017 | $4,134 | $175,113 | $41,580 | $134,720 |
| 2016 | $3,890 | $164,749 | $25,200 | $139,549 |
| 2015 | $3,435 | $144,722 | $25,200 | $119,522 |
| 2013 | -- | $130,393 | $25,200 | $105,193 |
Source: Public Records
Map
Nearby Homes
- 249 Pine Crest Dr
- 219 Hilltop Dr
- 480 Wilkerson Ln
- 484 Wilkerson Ln
- 206 Loving Trail
- 204 Loving Trail
- 205 Loving Trail
- 207 Loving Trail
- 209 Loving Trail
- 203 Loving Trail
- 319 Allen Dr
- 609 Autumn Ave
- 228 Ovaletta Dr
- 514 Hillcrest Cir
- 533 Hillcrest Cir
- 504 Lakeway Ln
- 521 Hillcrest Cir
- 500 Lakeway Ln
- 450 Lone Star Dr
- 452 Lone Star Dr
- 241 Cedar Crest Dr
- 235 Cedar Crest Dr
- 243 Cedar Crest Dr
- 238 Cedar Crest Dr
- 236 Cedar Crest Dr
- 240 Cedar Crest Dr
- 233 Cedar Crest Dr
- 245 Cedar Crest Dr
- 234 Cedar Crest Dr
- 242 Cedar Crest Dr
- 232 Cedar Crest Dr
- 231 Cedar Crest Dr
- 244 Cedar Crest Dr
- 247 Cedar Crest Dr
- 243 Hilltop Dr
- 241 Hilltop Dr
- 245 Hilltop Dr
- 239 Hilltop Dr
- 247 Hilltop Dr
- 246 Cedar Crest Dr