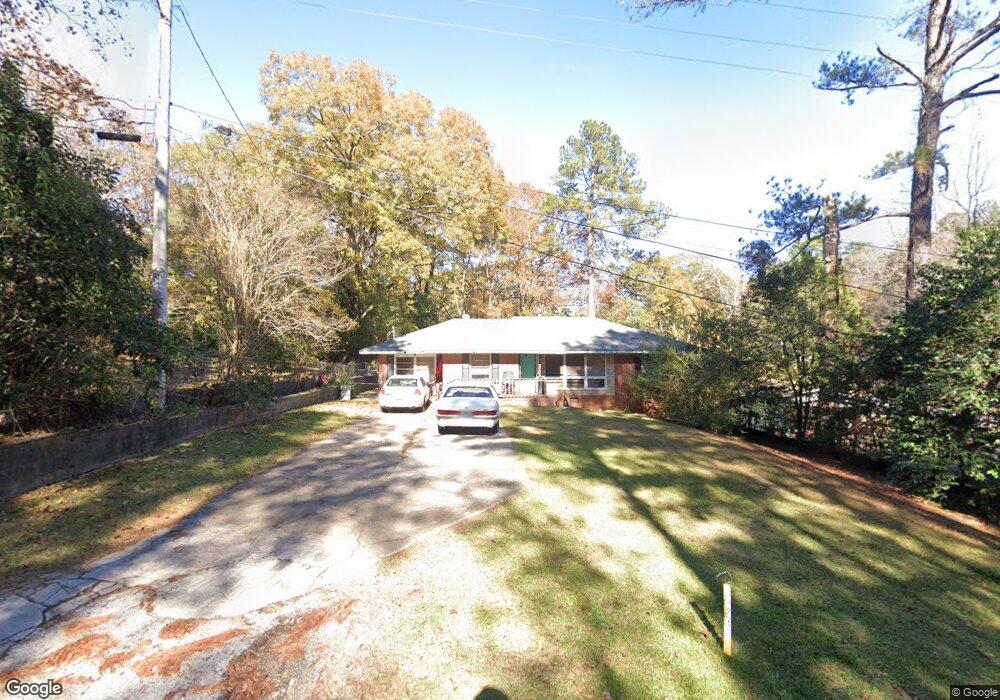
239 Collins Dr Columbus, GA 31903
Southern Columbus NeighborhoodEstimated Value: $67,000 - $97,000
3
Beds
2
Baths
1,472
Sq Ft
$55/Sq Ft
Est. Value
About This Home
This home is located at 239 Collins Dr, Columbus, GA 31903 and is currently estimated at $81,264, approximately $55 per square foot. 239 Collins Dr is a home located in Muscogee County with nearby schools including Glenallen Elementary School, Dorothy Height Elementary School, and Eddy Middle School.
Ownership History
Date
Name
Owned For
Owner Type
Purchase Details
Closed on
Apr 23, 2019
Sold by
Platt Paul
Bought by
Powell David
Current Estimated Value
Home Financials for this Owner
Home Financials are based on the most recent Mortgage that was taken out on this home.
Original Mortgage
$28,000
Outstanding Balance
$24,465
Interest Rate
4%
Mortgage Type
New Conventional
Estimated Equity
$56,799
Purchase Details
Closed on
Oct 5, 2012
Sold by
Rp Investment Llc
Bought by
Platt Paul and Platt Rowena
Purchase Details
Closed on
Jul 30, 2009
Sold by
Platt Paul and Platt Rowena
Bought by
R P Investment Llc
Purchase Details
Closed on
Jul 31, 2008
Sold by
Deutsche Bank National Trust Co
Bought by
Platt Rowena F and Platt Paul A
Purchase Details
Closed on
May 6, 2008
Sold by
Sanders Yvonne and Porter Yvonne M
Bought by
Deutsche Bank National Trust Company
Create a Home Valuation Report for This Property
The Home Valuation Report is an in-depth analysis detailing your home's value as well as a comparison with similar homes in the area
Home Values in the Area
Average Home Value in this Area
Purchase History
| Date | Buyer | Sale Price | Title Company |
|---|---|---|---|
| Powell David | $45,000 | -- | |
| Platt Paul | -- | -- | |
| R P Investment Llc | -- | None Available | |
| Platt Rowena F | $35,000 | None Available | |
| Deutsche Bank National Trust Company | $50,866 | None Available |
Source: Public Records
Mortgage History
| Date | Status | Borrower | Loan Amount |
|---|---|---|---|
| Open | Powell David | $28,000 |
Source: Public Records
Tax History Compared to Growth
Tax History
| Year | Tax Paid | Tax Assessment Tax Assessment Total Assessment is a certain percentage of the fair market value that is determined by local assessors to be the total taxable value of land and additions on the property. | Land | Improvement |
|---|---|---|---|---|
| 2025 | $1,020 | $26,068 | $6,068 | $20,000 |
| 2024 | $1,005 | $25,680 | $4,480 | $21,200 |
| 2023 | $1,012 | $25,680 | $4,480 | $21,200 |
| 2022 | $710 | $17,380 | $4,480 | $12,900 |
| 2021 | $682 | $16,692 | $4,480 | $12,212 |
| 2020 | $682 | $16,692 | $4,480 | $12,212 |
| 2019 | $372 | $9,076 | $4,480 | $4,596 |
| 2018 | $372 | $9,076 | $4,480 | $4,596 |
| 2017 | $610 | $14,852 | $4,480 | $10,372 |
| 2016 | $998 | $24,191 | $2,324 | $21,867 |
| 2015 | $999 | $24,191 | $2,324 | $21,867 |
| 2014 | $1,000 | $24,191 | $2,324 | $21,867 |
| 2013 | -- | $24,191 | $2,324 | $21,867 |
Source: Public Records
Map
Nearby Homes
- 235 Collins Dr
- 243 Robert e Lee Dr
- 245 Robert e Lee Dr
- 231 Collins Dr
- 227 Collins Dr
- 5 Artillery Dr
- 1 Artillery Dr
- 9 Artillery Dr
- 223 Collins Dr
- 7 Artillery Dr
- 238 Robert e Lee Dr
- 240 Robert e Lee Dr
- 242 Robert e Lee Dr
- 244 Robert e Lee Dr
- 11 Artillery Dr
- 246 Robert e Lee Dr
- 219 Collins Dr
- 248 Robert e Lee Dr
- 13 Artillery Dr
- 220 Collins Dr