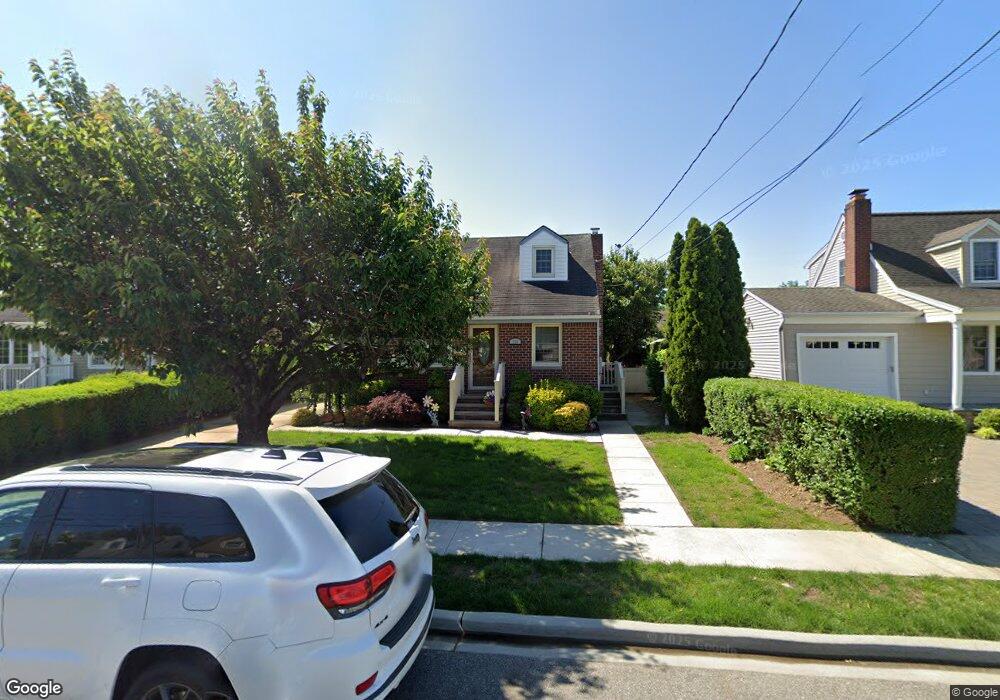
239 Dow Ave Mineola, NY 11501
Estimated Value: $801,000 - $831,839
4
Beds
2
Baths
1,155
Sq Ft
$707/Sq Ft
Est. Value
About This Home
This home is located at 239 Dow Ave, Mineola, NY 11501 and is currently estimated at $816,420, approximately $706 per square foot. 239 Dow Ave is a home located in Nassau County with nearby schools including Rushmore Avenue School, Cherry Lane School, and Carle Place High School.
Ownership History
Date
Name
Owned For
Owner Type
Purchase Details
Closed on
Feb 8, 2021
Sold by
Pereira Antonio and Pereira Laura
Bought by
Prisco Matthew and Mondello Jackie
Current Estimated Value
Home Financials for this Owner
Home Financials are based on the most recent Mortgage that was taken out on this home.
Original Mortgage
$325,000
Outstanding Balance
$290,425
Interest Rate
2.65%
Mortgage Type
New Conventional
Estimated Equity
$525,995
Purchase Details
Closed on
Feb 25, 2010
Sold by
Santos Monica
Bought by
Pereria Antonio and Greenough Laura
Purchase Details
Closed on
Aug 21, 2002
Sold by
Park Soung-Ok
Bought by
Santos Monica
Purchase Details
Closed on
May 6, 1996
Sold by
Gable James and Gable Nadine
Bought by
Park Soung-Ok and Park Yung
Home Financials for this Owner
Home Financials are based on the most recent Mortgage that was taken out on this home.
Original Mortgage
$169,000
Interest Rate
7.77%
Create a Home Valuation Report for This Property
The Home Valuation Report is an in-depth analysis detailing your home's value as well as a comparison with similar homes in the area
Home Values in the Area
Average Home Value in this Area
Purchase History
| Date | Buyer | Sale Price | Title Company |
|---|---|---|---|
| Prisco Matthew | $625,000 | None Available | |
| Pereria Antonio | $335,000 | -- | |
| Santos Monica | $370,000 | -- | |
| Park Soung-Ok | $212,000 | -- |
Source: Public Records
Mortgage History
| Date | Status | Borrower | Loan Amount |
|---|---|---|---|
| Open | Prisco Matthew | $325,000 | |
| Previous Owner | Park Soung-Ok | $169,000 |
Source: Public Records
Tax History Compared to Growth
Tax History
| Year | Tax Paid | Tax Assessment Tax Assessment Total Assessment is a certain percentage of the fair market value that is determined by local assessors to be the total taxable value of land and additions on the property. | Land | Improvement |
|---|---|---|---|---|
| 2025 | $12,163 | $568 | $264 | $304 |
| 2024 | $2,164 | $536 | $264 | $272 |
| 2023 | $10,218 | $536 | $264 | $272 |
| 2022 | $10,218 | $506 | $264 | $242 |
| 2021 | $9,047 | $478 | $222 | $256 |
| 2020 | $6,685 | $726 | $719 | $7 |
| 2019 | $7,382 | $726 | $719 | $7 |
| 2018 | $7,382 | $726 | $0 | $0 |
| 2017 | $5,116 | $726 | $558 | $168 |
| 2016 | $6,851 | $935 | $719 | $216 |
| 2015 | $2,074 | $935 | $719 | $216 |
| 2014 | $2,074 | $935 | $719 | $216 |
| 2013 | $2,002 | $935 | $719 | $216 |
Source: Public Records
Map
Nearby Homes
- 135 Barwick Blvd
- 120 Bruce Terrace
- 216 Raff Ave
- 222 Clemens Rd
- 23 Park Cir
- 215 Sheridan Blvd
- 253 Raff Ave
- 180 Evelyn Rd
- 296 Jerome Ave
- 227 Brown St
- 323 Barwick Blvd
- 239 Mckinley Pkwy
- 101 Brown St
- 201 Jamaica Blvd
- 211 Mineola Ave
- 41 Jackson Ave
- 43 Shortridge Dr
- 47 Jackson Ave
- 128 Charles St
- 60 Pell Terrace