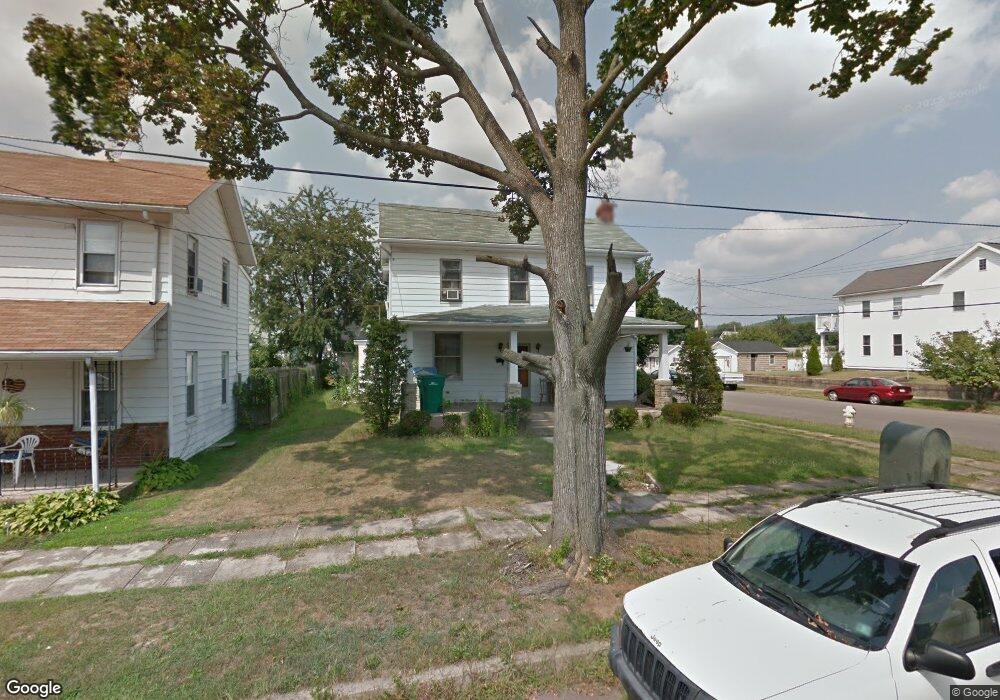
239 E 8th St Berwick, PA 18603
Estimated Value: $186,000 - $263,017
3
Beds
1
Bath
2,760
Sq Ft
$83/Sq Ft
Est. Value
About This Home
This home is located at 239 E 8th St, Berwick, PA 18603 and is currently estimated at $228,754, approximately $82 per square foot. 239 E 8th St is a home located in Columbia County with nearby schools including Berwick Area High School, Holy Family Consolidated School, and New Story School.
Ownership History
Date
Name
Owned For
Owner Type
Purchase Details
Closed on
Jun 16, 2021
Sold by
Malatesta Fred M
Bought by
Radice Tyler Marie and Paine Matthew
Current Estimated Value
Home Financials for this Owner
Home Financials are based on the most recent Mortgage that was taken out on this home.
Original Mortgage
$188,100
Outstanding Balance
$170,301
Interest Rate
2.9%
Mortgage Type
New Conventional
Estimated Equity
$58,453
Purchase Details
Closed on
Apr 2, 2020
Sold by
2019 Castle Llc
Bought by
Malatesta Fred M
Purchase Details
Closed on
Jan 13, 2020
Sold by
Deutsche Bank National Trust Company
Bought by
2019 Castle Llc
Purchase Details
Closed on
Jul 31, 2019
Sold by
Patterson Holly L and Patterson Aaron J
Bought by
Deutsche Bank National Trusts
Purchase Details
Closed on
Jul 29, 2013
Sold by
Patterson Aaron J and Patterson Holly L
Bought by
Patterson Holly L
Create a Home Valuation Report for This Property
The Home Valuation Report is an in-depth analysis detailing your home's value as well as a comparison with similar homes in the area
Home Values in the Area
Average Home Value in this Area
Purchase History
| Date | Buyer | Sale Price | Title Company |
|---|---|---|---|
| Radice Tyler Marie | $209,000 | None Available | |
| Malatesta Fred M | $24,900 | None Available | |
| 2019 Castle Llc | $13,280 | None Available | |
| Deutsche Bank National Trusts | $3,841 | None Available | |
| Patterson Holly L | -- | None Available |
Source: Public Records
Mortgage History
| Date | Status | Borrower | Loan Amount |
|---|---|---|---|
| Open | Radice Tyler Marie | $188,100 |
Source: Public Records
Tax History
| Year | Tax Paid | Tax Assessment Tax Assessment Total Assessment is a certain percentage of the fair market value that is determined by local assessors to be the total taxable value of land and additions on the property. | Land | Improvement |
|---|---|---|---|---|
| 2025 | $1,614 | $18,002 | $0 | $0 |
| 2024 | $1,596 | $18,002 | $2,500 | $15,502 |
| 2023 | $1,488 | $18,002 | $2,500 | $15,502 |
| 2022 | $1,439 | $18,002 | $2,500 | $15,502 |
| 2021 | $1,407 | $18,002 | $2,500 | $15,502 |
| 2020 | $1,375 | $18,002 | $2,500 | $15,502 |
| 2019 | $1,353 | $18,002 | $2,500 | $15,502 |
| 2018 | $1,300 | $18,002 | $2,500 | $15,502 |
| 2017 | $1,305 | $18,002 | $2,500 | $15,502 |
| 2016 | -- | $18,002 | $2,500 | $15,502 |
| 2015 | -- | $18,002 | $2,500 | $15,502 |
| 2014 | -- | $18,002 | $2,500 | $15,502 |
Source: Public Records
Map
Nearby Homes
Your Personal Tour Guide
Ask me questions while you tour the home.