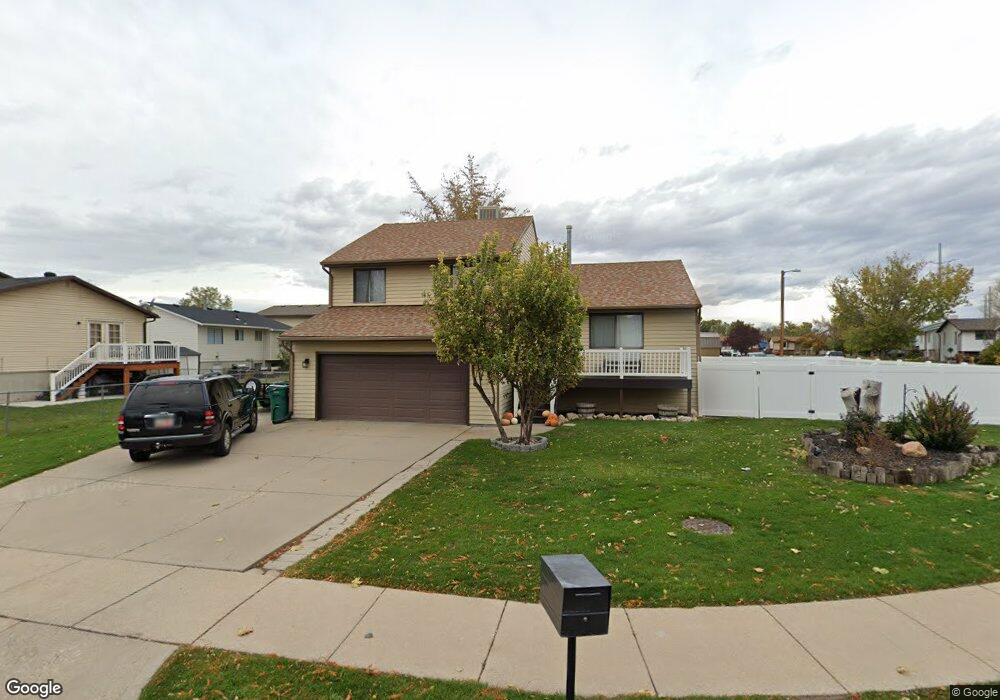
239 E 975 S Layton, UT 84041
Estimated Value: $483,433 - $553,000
4
Beds
3
Baths
2,150
Sq Ft
$235/Sq Ft
Est. Value
About This Home
This home is located at 239 E 975 S, Layton, UT 84041 and is currently estimated at $505,358, approximately $235 per square foot. 239 E 975 S is a home located in Davis County with nearby schools including Layton Elementary School, Fairfield Junior High School, and Davis High School.
Ownership History
Date
Name
Owned For
Owner Type
Purchase Details
Closed on
Sep 30, 2013
Sold by
Schmelzenbach Debi D and Schmelzenbach Mark W
Bought by
Schmelzenbach Mark W and Schmelzenbach Debi D
Current Estimated Value
Purchase Details
Closed on
Jul 21, 2003
Sold by
Schmelzenbach Mark W and Schmelzenbach Debi D
Bought by
Schmelzenbach Mark W and Schmelzenbach Debi D
Home Financials for this Owner
Home Financials are based on the most recent Mortgage that was taken out on this home.
Original Mortgage
$80,000
Outstanding Balance
$28,223
Interest Rate
3%
Mortgage Type
Purchase Money Mortgage
Estimated Equity
$477,135
Purchase Details
Closed on
Aug 26, 1998
Sold by
Ketcham Mark L and Ketcham Jeri L
Bought by
Schmelzenbach Mark W and Schmelzenbach Debi D
Home Financials for this Owner
Home Financials are based on the most recent Mortgage that was taken out on this home.
Original Mortgage
$113,500
Interest Rate
6.91%
Create a Home Valuation Report for This Property
The Home Valuation Report is an in-depth analysis detailing your home's value as well as a comparison with similar homes in the area
Home Values in the Area
Average Home Value in this Area
Purchase History
| Date | Buyer | Sale Price | Title Company |
|---|---|---|---|
| Schmelzenbach Mark W | -- | None Available | |
| Schmelzenbach Mark W | -- | Backman Stewart Title Servic | |
| Schmelzenbach Mark W | -- | Associated Title Company |
Source: Public Records
Mortgage History
| Date | Status | Borrower | Loan Amount |
|---|---|---|---|
| Open | Schmelzenbach Mark W | $80,000 | |
| Closed | Schmelzenbach Mark W | $113,500 |
Source: Public Records
Tax History
| Year | Tax Paid | Tax Assessment Tax Assessment Total Assessment is a certain percentage of the fair market value that is determined by local assessors to be the total taxable value of land and additions on the property. | Land | Improvement |
|---|---|---|---|---|
| 2025 | -- | $252,450 | $98,231 | $154,219 |
| 2024 | -- | $244,749 | $110,100 | $134,649 |
| 2023 | $2,173 | $222,750 | $58,346 | $164,403 |
| 2022 | $2,347 | $432,000 | $124,136 | $307,864 |
| 2021 | $2,067 | $312,000 | $102,450 | $209,550 |
| 2020 | $1,851 | $268,000 | $85,631 | $182,369 |
| 2019 | $1,777 | $252,000 | $89,431 | $162,569 |
| 2018 | $1,608 | $229,000 | $82,380 | $146,620 |
| 2016 | $1,447 | $106,315 | $31,530 | $74,785 |
| 2015 | $1,375 | $95,865 | $31,530 | $64,335 |
| 2014 | $1,567 | $99,000 | $31,530 | $67,470 |
| 2013 | -- | $85,635 | $16,565 | $69,070 |
Source: Public Records
Map
Nearby Homes
- 948 S 250 E
- 949 S 225 E
- 282 E 925 S
- 799 S 125 E
- 80 E 850 S
- 706 S 600 E
- 811 S Main St
- 753 S 300 E
- 389 Morgan St
- 623 E Clearwater Dr Unit 15
- 905 S Main St Unit G
- 617 E 405 S
- 895 S Main St Unit E
- 917 S Main St Unit H
- 679 S Clearwater Falls Dr
- 680 N Main St Trlr E-11
- 189 S Main St Unit 76
- 189 S Main St Unit 21
- 680 N Main St Unit B13
- 680 N Main St Unit D14
Your Personal Tour Guide
Ask me questions while you tour the home.