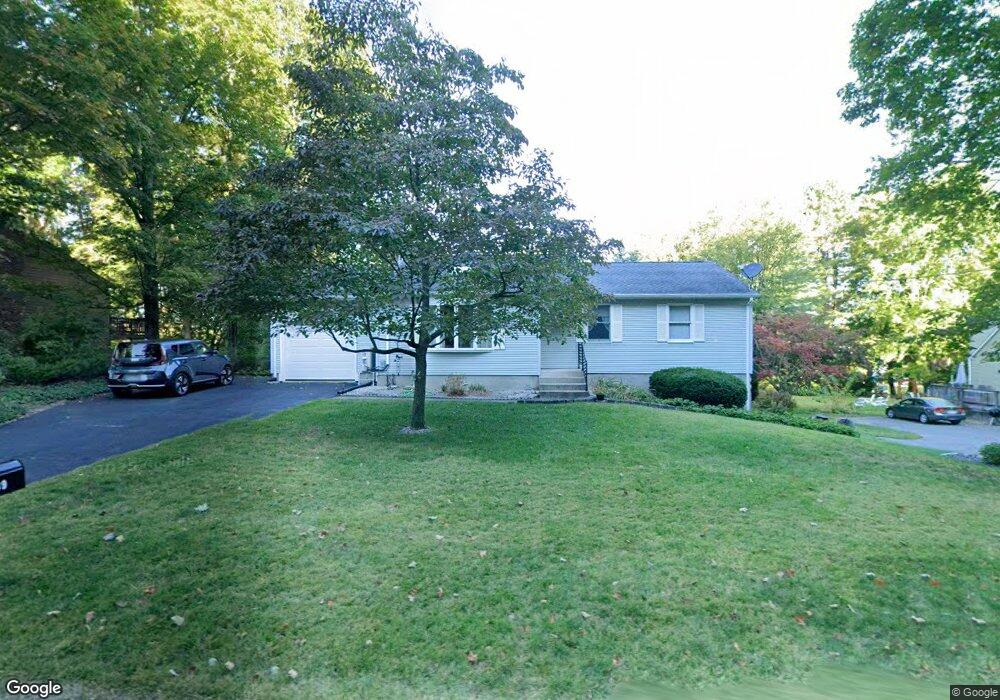
239 East St Easthampton, MA 01027
Estimated Value: $422,626 - $449,000
About This Home
This home is located at 239 East St, Easthampton, MA 01027 and is currently estimated at $432,157, approximately $358 per square foot. 239 East St is a home located in Hampshire County with nearby schools including Easthampton High School, Hilltown Cooperative Charter Public School, and Tri-County Schools.
Ownership History
We collect this data history from publicly available records. To have your information removed, we recommend requesting removal directly through your county’s website.
Purchase Details
Home Financials for this Owner
Home Financials are based on the most recent Mortgage that was taken out on this home.Home Values in the Area
Average Home Value in this Area
Purchase History
We collect this data history from publicly available records. To have your information removed, we recommend requesting removal directly through your county’s website.
| Date | Buyer | Sale Price | Title Company |
|---|---|---|---|
| $118,000 | -- | ||
| $105,000 | -- |
Mortgage History
We collect this data history from publicly available records. To have your information removed, we recommend requesting removal directly through your county’s website.
| Date | Status | Borrower | Loan Amount |
|---|---|---|---|
| Open | $22,200 | ||
| Closed | $103,540 | ||
| Closed | $33,000 |
Tax History
We collect this data history from publicly available records. To have your information removed, we recommend requesting removal directly through your county’s website.
| Year | Tax Paid | Tax Assessment Tax Assessment Total Assessment is a certain percentage of the fair market value that is determined by local assessors to be the total taxable value of land and additions on the property. | Land | Improvement |
|---|---|---|---|---|
| 2025 | $5,420 | $396,500 | $110,700 | $285,800 |
| 2024 | $5,321 | $392,400 | $107,500 | $284,900 |
| 2023 | $3,979 | $271,600 | $85,000 | $186,600 |
| 2022 | $4,490 | $271,600 | $85,000 | $186,600 |
| 2021 | $4,930 | $281,100 | $85,000 | $196,100 |
| 2020 | $4,824 | $271,600 | $85,000 | $186,600 |
| 2019 | $4,024 | $260,300 | $85,000 | $175,300 |
| 2018 | $3,850 | $240,600 | $80,400 | $160,200 |
| 2017 | $3,756 | $231,700 | $77,200 | $154,500 |
| 2016 | $3,746 | $240,300 | $77,200 | $163,100 |
| 2015 | $3,641 | $240,300 | $77,200 | $163,100 |
Map
- 11 Fort Hill Rd
- 6 Valley Ln
- 74 Parsons St
- 22 Maine Ave Unit 22
- 52 Knipfer Ave
- 17 Olympia St
- 64 Mount Tom Ave
- 26 Mount Tom Ave
- 64-66 Pleasant St
- 17 Adams St
- 14 Holyoke St
- 27 Holyoke St
- 52-54 Holyoke St
- 25 Ballard St
- 123 Holyoke St
- 28 Winter St Unit 28
- 85 Garfield Ave
- 296 Old Wilson Rd
- 54 S Park Terrace
- 12 Greenwood Ct
Ask me questions while you tour the home.