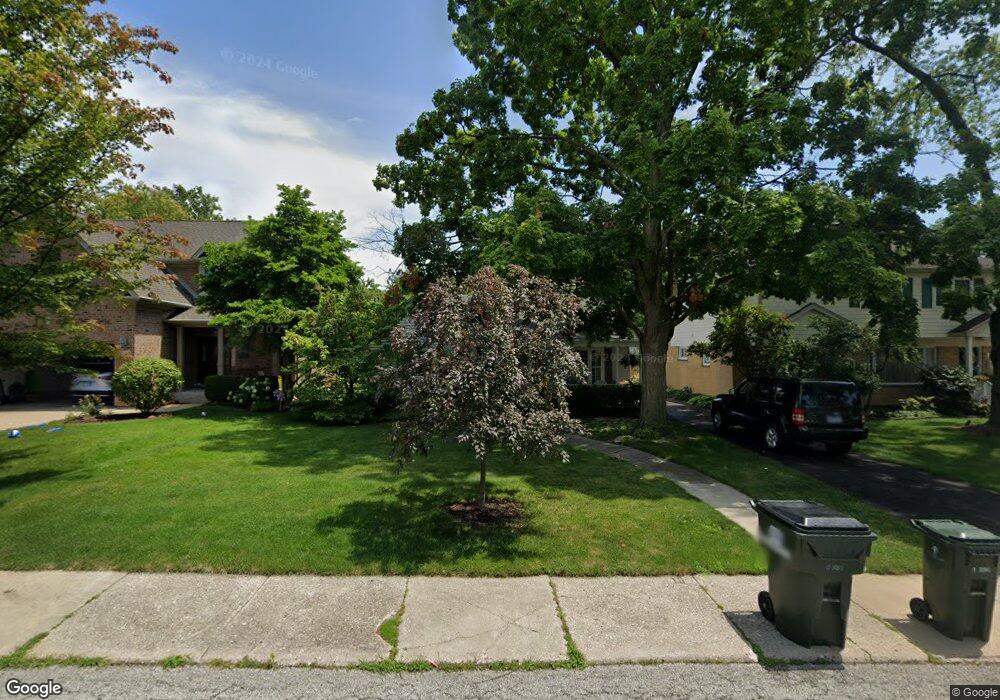
239 Elm St Glenview, IL 60025
Estimated Value: $467,000 - $543,000
3
Beds
2
Baths
1,033
Sq Ft
$488/Sq Ft
Est. Value
About This Home
This home is located at 239 Elm St, Glenview, IL 60025 and is currently estimated at $503,729, approximately $487 per square foot. 239 Elm St is a home located in Cook County with nearby schools including Hoffman Elementary School, Henking Elementary School, and Springman Middle School.
Ownership History
Date
Name
Owned For
Owner Type
Purchase Details
Closed on
Oct 9, 2015
Sold by
Iverson Ellen R
Bought by
Iverson Ellen R and The Ellen R Iverson Trust
Current Estimated Value
Purchase Details
Closed on
Jun 15, 1998
Sold by
Brill Edward R and Redman Lesley A
Bought by
Iverson Ellen R
Home Financials for this Owner
Home Financials are based on the most recent Mortgage that was taken out on this home.
Original Mortgage
$156,000
Outstanding Balance
$29,044
Interest Rate
7.22%
Estimated Equity
$474,685
Purchase Details
Closed on
Nov 11, 1994
Sold by
Kaufman Oliver H
Bought by
Brill Edward R and Redman Lesley A
Home Financials for this Owner
Home Financials are based on the most recent Mortgage that was taken out on this home.
Original Mortgage
$147,600
Interest Rate
8.5%
Create a Home Valuation Report for This Property
The Home Valuation Report is an in-depth analysis detailing your home's value as well as a comparison with similar homes in the area
Home Values in the Area
Average Home Value in this Area
Purchase History
| Date | Buyer | Sale Price | Title Company |
|---|---|---|---|
| Iverson Ellen R | -- | Attorney | |
| Iverson Ellen R | $195,000 | -- | |
| Brill Edward R | $164,000 | -- |
Source: Public Records
Mortgage History
| Date | Status | Borrower | Loan Amount |
|---|---|---|---|
| Open | Iverson Ellen R | $156,000 | |
| Previous Owner | Brill Edward R | $147,600 |
Source: Public Records
Tax History
| Year | Tax Paid | Tax Assessment Tax Assessment Total Assessment is a certain percentage of the fair market value that is determined by local assessors to be the total taxable value of land and additions on the property. | Land | Improvement |
|---|---|---|---|---|
| 2025 | $2,232 | $37,000 | $8,500 | $28,500 |
| 2024 | $2,232 | $33,000 | $7,140 | $25,860 |
| 2023 | $2,239 | $33,000 | $7,140 | $25,860 |
| 2022 | $2,239 | $33,000 | $7,140 | $25,860 |
| 2021 | $2,526 | $23,158 | $6,120 | $17,038 |
| 2020 | $2,411 | $23,158 | $6,120 | $17,038 |
| 2019 | $2,167 | $29,315 | $6,120 | $23,195 |
| 2018 | $2,411 | $21,081 | $5,270 | $15,811 |
| 2017 | $2,318 | $21,081 | $5,270 | $15,811 |
| 2016 | $2,776 | $21,081 | $5,270 | $15,811 |
| 2015 | $3,282 | $18,126 | $4,420 | $13,706 |
| 2014 | $3,152 | $18,126 | $4,420 | $13,706 |
| 2013 | $2,698 | $18,126 | $4,420 | $13,706 |
Source: Public Records
Map
Nearby Homes
- 38 Washington St
- 245 Nora Ave
- 440 Briarhill Rd
- 517 Briarhill Ln
- 311 Neva Ave
- 2009 Robincrest Ln
- 625 Wissing Ln
- 9516 Marion Ave
- 2506 Allison Ct
- 7434 Emerson St
- 1730 George Ct
- 7030 Foster St
- 2537 Pick Dr
- 216 Flora Ave
- 7303 Ponto Dr
- 7301 Ponto Dr
- 9317 Olcott Ave
- 609 Carriage Hill Dr
- 706 Waukegan Rd Unit 4
- 2700 Fontana Dr
Your Personal Tour Guide
Ask me questions while you tour the home.