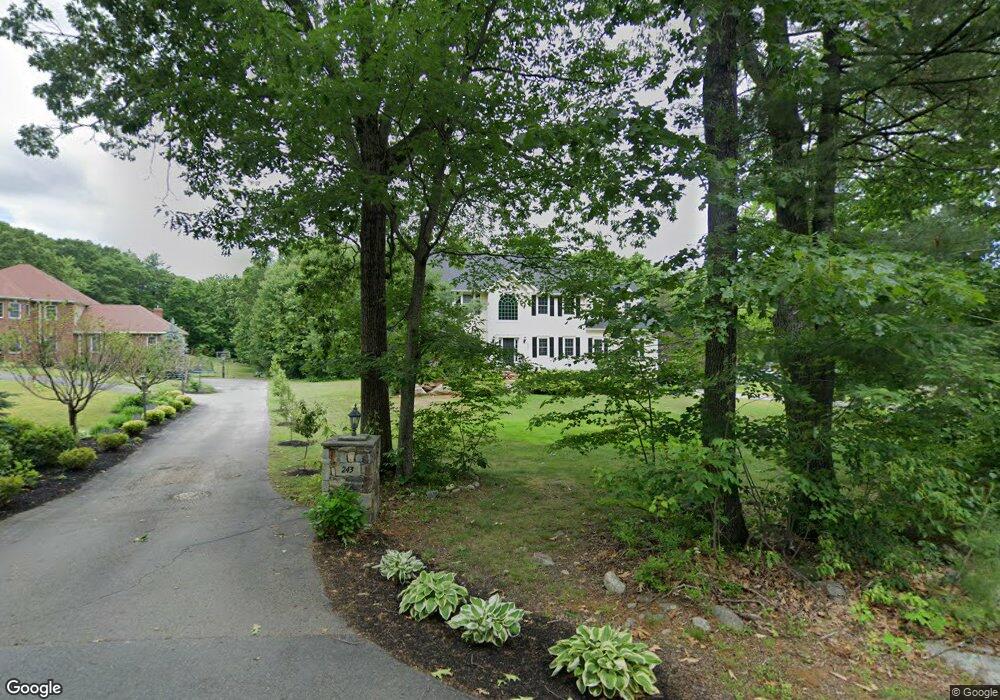
239 Fisher Rd Holden, MA 01520
Estimated Value: $936,138 - $1,270,000
4
Beds
3
Baths
3,445
Sq Ft
$307/Sq Ft
Est. Value
About This Home
This home is located at 239 Fisher Rd, Holden, MA 01520 and is currently estimated at $1,059,035, approximately $307 per square foot. 239 Fisher Rd is a home located in Worcester County with nearby schools including Wachusett Regional High School, Holden Christian Academy, and The T.E.C. Schools.
Ownership History
Date
Name
Owned For
Owner Type
Purchase Details
Closed on
Aug 30, 2010
Sold by
Ne Realty Llc
Bought by
Reitz Edward R and Reitz Kerry A
Current Estimated Value
Home Financials for this Owner
Home Financials are based on the most recent Mortgage that was taken out on this home.
Original Mortgage
$318,054
Outstanding Balance
$211,403
Interest Rate
4.57%
Mortgage Type
Purchase Money Mortgage
Estimated Equity
$847,632
Purchase Details
Closed on
Jan 28, 2010
Sold by
Savasta Mark
Bought by
Ne Realty Llc
Purchase Details
Closed on
Nov 13, 2008
Sold by
Indymac Fed Bk
Bought by
Savasta Mark
Purchase Details
Closed on
Oct 21, 2008
Sold by
Albert Neal
Bought by
Indymac Fed Bk
Purchase Details
Closed on
Mar 3, 2006
Sold by
Lifestyle Bldrs Llc
Bought by
Albert Neal
Home Financials for this Owner
Home Financials are based on the most recent Mortgage that was taken out on this home.
Original Mortgage
$399,500
Interest Rate
6.16%
Mortgage Type
Purchase Money Mortgage
Create a Home Valuation Report for This Property
The Home Valuation Report is an in-depth analysis detailing your home's value as well as a comparison with similar homes in the area
Home Values in the Area
Average Home Value in this Area
Purchase History
| Date | Buyer | Sale Price | Title Company |
|---|---|---|---|
| Reitz Edward R | $499,900 | -- | |
| Ne Realty Llc | -- | -- | |
| Savasta Mark | $133,000 | -- | |
| Indymac Fed Bk | $250,000 | -- | |
| Albert Neal | $156,750 | -- |
Source: Public Records
Mortgage History
| Date | Status | Borrower | Loan Amount |
|---|---|---|---|
| Open | Reitz Edward R | $318,054 | |
| Previous Owner | Albert Neal | $399,500 |
Source: Public Records
Tax History Compared to Growth
Tax History
| Year | Tax Paid | Tax Assessment Tax Assessment Total Assessment is a certain percentage of the fair market value that is determined by local assessors to be the total taxable value of land and additions on the property. | Land | Improvement |
|---|---|---|---|---|
| 2025 | $10,844 | $782,400 | $202,000 | $580,400 |
| 2024 | $10,804 | $763,500 | $196,200 | $567,300 |
| 2023 | $10,271 | $685,200 | $170,500 | $514,700 |
| 2022 | $9,880 | $596,600 | $133,500 | $463,100 |
| 2021 | $9,561 | $549,500 | $127,300 | $422,200 |
| 2020 | $9,313 | $547,800 | $121,500 | $426,300 |
| 2019 | $9,135 | $523,500 | $121,500 | $402,000 |
| 2018 | $8,875 | $504,000 | $115,800 | $388,200 |
| 2017 | $8,491 | $482,700 | $115,800 | $366,900 |
| 2016 | $7,930 | $459,700 | $110,500 | $349,200 |
| 2015 | $8,018 | $442,500 | $110,500 | $332,000 |
| 2014 | $7,854 | $442,500 | $110,500 | $332,000 |
Source: Public Records
Map
Nearby Homes
- 288 Fisher Rd
- 68 Fisher Rd
- 4 Barrows Rd
- 303 Greenwich Ct Unit 303
- 3901 Knightsbridge Close Unit 3901
- 4004 Brompton Cir
- 770 Salisbury St Unit 201
- 10 Salisbury Hill Blvd Unit 75
- 25 Salisbury Hill Blvd Unit 64
- 25 Salisbury Hill Blvd Unit 52
- 25 Salisbury Hill Blvd Unit 69
- 25 Salisbury Hill Blvd Unit 67
- 25 Salisbury Hill Blvd Unit 51
- 25 Salisbury Hill Blvd Unit 65
- 527 Salisbury St
- 49 Barry Rd
- 46 Barry Rd
- 7 Dubiel Dr
- 61 Barry Rd
- 10 Sumac Cir