
Seller's Agent in 2019
Samantha Stumpo
New Brook Realty Group, LLC
(781) 453-0800
1 in this area
32 Total Sales


Estimated Value: $1,758,000 - $2,366,000
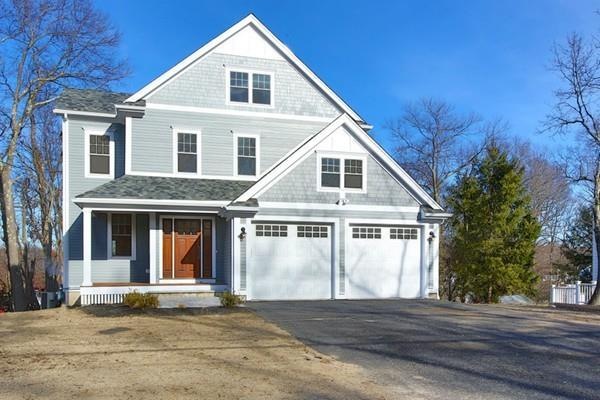
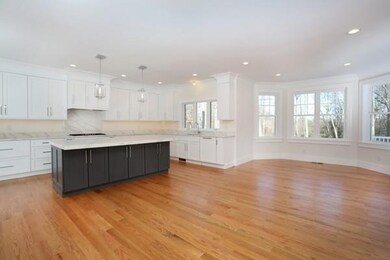
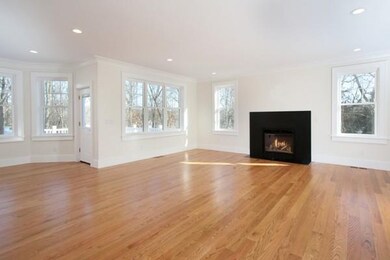
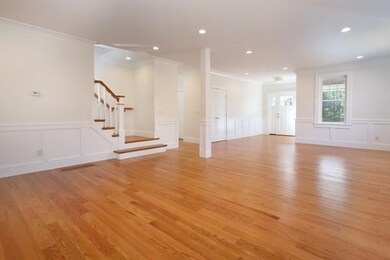
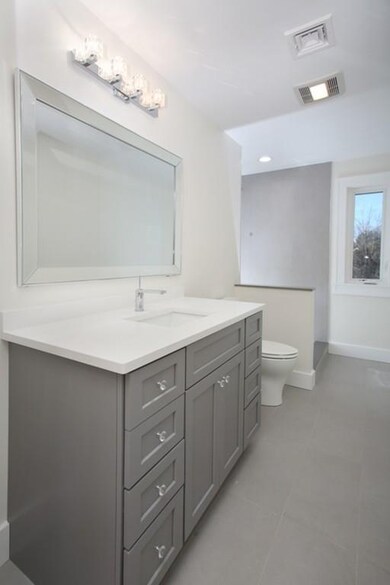
Gorgeous colonial home on a beautiful street located in Needham, this home has something for everyone. Open foyer leads into oversize eat-in Kitchen with bespoke cabinetry, professional grade appliances, and beautiful quartz countertops. The family room is bathed in light, and features a gorgeous fireplace that will be the focal point of your new home. Entertaining space is provided for with an elegant paneled living room and dining room, all replete with signature moldings and trim, beautiful hardwood floors, and the small touches through out. Master suite encompasses enormous Master Bedroom, multiple oversize walk-in closets, and signature master bathroom with private water closet, dual vanities, and soaking tub bathed in natural light. four additional bedrooms, two bathrooms, and second floor laundry room complete the upstairs. A two car garage,mudroom, professional landscaping and the list goes on!
| Date | Buyer | Sale Price | Title Company |
|---|---|---|---|
| Dixon Ronald | -- | None Available | |
| Dixon Ronald | -- | None Available | |
| 239 High Rock Llc | $500,000 | -- | |
| 239 High Rock Llc | $500,000 | -- |
| Date | Status | Borrower | Loan Amount |
|---|---|---|---|
| Open | Dixon Ronald | $1,048,500 | |
| Closed | Dixon Ronald | $1,048,500 | |
| Previous Owner | 239 High Rock Llc | $925,000 |
| Date | Event | Price | List to Sale | Price per Sq Ft | Prior Sale |
|---|---|---|---|---|---|
| 03/28/2019 03/28/19 | Sold | $1,380,000 | -4.8% | $321 / Sq Ft | |
| 01/25/2019 01/25/19 | Pending | -- | -- | -- | |
| 01/21/2019 01/21/19 | Price Changed | $1,448,900 | 0.0% | $337 / Sq Ft | |
| 10/09/2018 10/09/18 | Price Changed | $1,449,000 | -3.3% | $337 / Sq Ft | |
| 06/03/2018 06/03/18 | For Sale | $1,499,000 | +199.8% | $349 / Sq Ft | |
| 02/01/2018 02/01/18 | Sold | $500,000 | -8.9% | $372 / Sq Ft | View Prior Sale |
| 10/25/2017 10/25/17 | Pending | -- | -- | -- | |
| 10/16/2017 10/16/17 | Price Changed | $549,000 | -6.2% | $408 / Sq Ft | |
| 10/04/2017 10/04/17 | For Sale | $585,000 | -- | $435 / Sq Ft |
| Year | Tax Paid | Tax Assessment Tax Assessment Total Assessment is a certain percentage of the fair market value that is determined by local assessors to be the total taxable value of land and additions on the property. | Land | Improvement |
|---|---|---|---|---|
| 2025 | $23,440 | $2,211,300 | $695,200 | $1,516,100 |
| 2024 | $25,146 | $2,008,500 | $539,900 | $1,468,600 |
| 2023 | $22,438 | $1,720,700 | $539,900 | $1,180,800 |
| 2022 | $21,618 | $1,616,900 | $500,700 | $1,116,200 |
| 2021 | $21,068 | $1,616,900 | $500,700 | $1,116,200 |
| 2020 | $20,365 | $1,630,500 | $500,700 | $1,129,800 |
| 2019 | $12,366 | $998,100 | $456,200 | $541,900 |
| 2018 | $6,950 | $585,000 | $456,200 | $128,800 |
| 2017 | $6,784 | $570,600 | $456,200 | $114,400 |
| 2016 | $6,604 | $572,300 | $456,200 | $116,100 |
| 2015 | $6,461 | $572,300 | $456,200 | $116,100 |
| 2014 | $6,149 | $528,300 | $415,700 | $112,600 |
Seller's Agent in 2019
Samantha Stumpo
New Brook Realty Group, LLC
(781) 453-0800
1 in this area
32 Total Sales
D
Buyer's Agent in 2019
Dave Scott
Apartment Rental Experts LLC
(617) 821-7598
9 Total Sales
Seller's Agent in 2018
Maureen Walsh
Hammond Residential Real Estate
(617) 527-2727
1 in this area
8 Total Sales
S
Buyer's Agent in 2018
Sam Sokol
360 Realty LLC
(617) 224-2800
1 Total Sale
Source: MLS Property Information Network (MLS PIN)
MLS Number: 72338703
APN: NEED-000044-000038
Disclaimer: Certain information contained herein is derived from information provided by parties other than Homes.com. All information provided is deemed reliable, but is not guaranteed to be accurate and should be independently verified.
![]() The property listing data and information, or the Images, set forth herein were provided to MLS Property Information Network, Inc. from third party sources, including sellers, lessors and public records, and were compiled by MLS Property Information Network, Inc. The property listing data and information, and the Images, are for the personal, non-commercial use of consumers having a good faith interest in purchasing or leasing listed properties of the type displayed to them and may not be used for any purpose other than to identify prospective properties which such consumers may have a good faith interest in purchasing or leasing. MLS Property Information Network, Inc. and its subscribers disclaim any and all representations and warranties as to the accuracy of the property listing data and information, or as to the accuracy of any of the Images, set forth herein.
The property listing data and information, or the Images, set forth herein were provided to MLS Property Information Network, Inc. from third party sources, including sellers, lessors and public records, and were compiled by MLS Property Information Network, Inc. The property listing data and information, and the Images, are for the personal, non-commercial use of consumers having a good faith interest in purchasing or leasing listed properties of the type displayed to them and may not be used for any purpose other than to identify prospective properties which such consumers may have a good faith interest in purchasing or leasing. MLS Property Information Network, Inc. and its subscribers disclaim any and all representations and warranties as to the accuracy of the property listing data and information, or as to the accuracy of any of the Images, set forth herein.
Ask me questions while you tour the home.