
Seller's Agent in 2019
Samantha Stumpo
New Brook Realty Group, LLC
(781) 453-0800
1 in this area
37 Total Sales
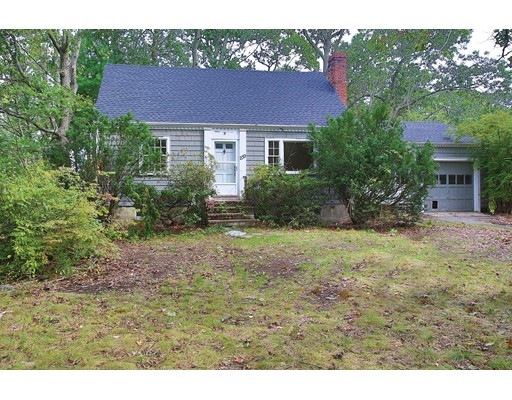
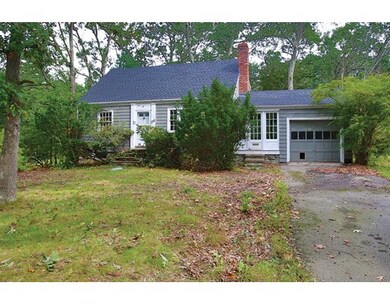
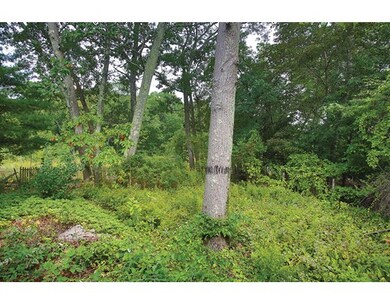
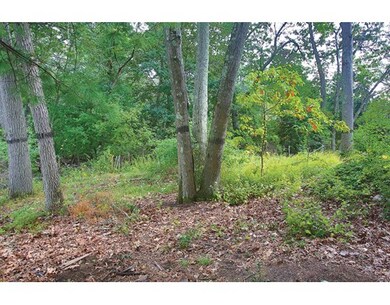
Attention builders....Sprawling 16,000 sq. foot lot in the heart of Needham. Buyer to perform all due diligence on development potential. Please do not walk the property without an appointment. Property and building to be sold “as is.â€
Home Type
Single Family
Est. Annual Taxes
$23,440
Year Built
1951
Lot Details
0
| Date | Type | Sale Price | Title Company |
|---|---|---|---|
| Quit Claim Deed | -- | None Available | |
| Quit Claim Deed | -- | None Available | |
| Personal Reps Deed | $500,000 | -- | |
| Personal Reps Deed | $500,000 | -- |
| Date | Status | Loan Amount | Loan Type |
|---|---|---|---|
| Open | $1,048,500 | Adjustable Rate Mortgage/ARM | |
| Closed | $1,048,500 | Adjustable Rate Mortgage/ARM | |
| Previous Owner | $1,012,500 | Purchase Money Mortgage | |
| Previous Owner | $100,000 | Commercial | |
| Previous Owner | $925,000 | Commercial |
| Date | Event | Price | Change | Sq Ft Price |
|---|---|---|---|---|
| 03/28/2019 03/28/19 | Sold | $1,380,000 | -4.8% | $321 / Sq Ft |
| 01/25/2019 01/25/19 | Pending | -- | -- | -- |
| 01/21/2019 01/21/19 | Price Changed | $1,448,900 | 0.0% | $337 / Sq Ft |
| 10/09/2018 10/09/18 | Price Changed | $1,449,000 | -3.3% | $337 / Sq Ft |
| 06/03/2018 06/03/18 | For Sale | $1,499,000 | +199.8% | $349 / Sq Ft |
| 02/01/2018 02/01/18 | Sold | $500,000 | -8.9% | $372 / Sq Ft |
| 10/25/2017 10/25/17 | Pending | -- | -- | -- |
| 10/16/2017 10/16/17 | Price Changed | $549,000 | -6.2% | $408 / Sq Ft |
| 10/04/2017 10/04/17 | For Sale | $585,000 | -- | $435 / Sq Ft |
| Year | Tax Paid | Tax Assessment Tax Assessment Total Assessment is a certain percentage of the fair market value that is determined by local assessors to be the total taxable value of land and additions on the property. | Land | Improvement |
|---|---|---|---|---|
| 2025 | $23,440 | $2,211,300 | $695,200 | $1,516,100 |
| 2024 | $25,146 | $2,008,500 | $539,900 | $1,468,600 |
| 2023 | $22,438 | $1,720,700 | $539,900 | $1,180,800 |
| 2022 | $21,618 | $1,616,900 | $500,700 | $1,116,200 |
| 2021 | $21,068 | $1,616,900 | $500,700 | $1,116,200 |
| 2020 | $20,365 | $1,630,500 | $500,700 | $1,129,800 |
| 2019 | $12,366 | $998,100 | $456,200 | $541,900 |
| 2018 | $6,950 | $585,000 | $456,200 | $128,800 |
| 2017 | $6,784 | $570,600 | $456,200 | $114,400 |
| 2016 | $6,604 | $572,300 | $456,200 | $116,100 |
| 2015 | $6,461 | $572,300 | $456,200 | $116,100 |
| 2014 | $6,149 | $528,300 | $415,700 | $112,600 |
Seller's Agent in 2019
Samantha Stumpo
New Brook Realty Group, LLC
(781) 453-0800
1 in this area
37 Total Sales
D
Buyer's Agent in 2019
Dave Scott
Apartment Rental Experts LLC
(617) 821-7598
6 Total Sales
Seller's Agent in 2018
Maureen Walsh
Hammond Residential Real Estate
(617) 527-2727
2 in this area
10 Total Sales
S
Buyer's Agent in 2018
Sam Sokol
360 Realty LLC
(617) 224-2800
2 Total Sales
Source: MLS Property Information Network (MLS PIN)
MLS Number: 72238919
APN: NEED-000044-000038
Disclaimer: Certain information contained herein is derived from information provided by parties other than Homes.com. All information provided is deemed reliable, but is not guaranteed to be accurate and should be independently verified.
![]() The property listing data and information, or the Images, set forth herein were provided to MLS Property Information Network, Inc. from third party sources, including sellers, lessors and public records, and were compiled by MLS Property Information Network, Inc. The property listing data and information, and the Images, are for the personal, non-commercial use of consumers having a good faith interest in purchasing or leasing listed properties of the type displayed to them and may not be used for any purpose other than to identify prospective properties which such consumers may have a good faith interest in purchasing or leasing. MLS Property Information Network, Inc. and its subscribers disclaim any and all representations and warranties as to the accuracy of the property listing data and information, or as to the accuracy of any of the Images, set forth herein.
The property listing data and information, or the Images, set forth herein were provided to MLS Property Information Network, Inc. from third party sources, including sellers, lessors and public records, and were compiled by MLS Property Information Network, Inc. The property listing data and information, and the Images, are for the personal, non-commercial use of consumers having a good faith interest in purchasing or leasing listed properties of the type displayed to them and may not be used for any purpose other than to identify prospective properties which such consumers may have a good faith interest in purchasing or leasing. MLS Property Information Network, Inc. and its subscribers disclaim any and all representations and warranties as to the accuracy of the property listing data and information, or as to the accuracy of any of the Images, set forth herein.